Modalities impacting the P-F curve

Advancements in condition-based maintenance tools to gauge asset health – as well as added pressures from today’s competitive business environment – have made that old standby, the P-F curve, as relevant as ever for reliability professionals in 2021.
This article is part of our monthly Tactics and Practices column. Read more Tactics and Practices.
The P-F curve, of course, visualizes an asset’s path from potential to functional failure. It portrays potential points of failure in an asset’s lifespan.
Updated models of the curve often feature a series of measurement technologies that can identify signs of wear and damage to avoid failure and extend the curve—that is, to extend the life of the asset. These technologies—oil analysis, ultrasound, vibration monitoring, thermography, and motor testing—are increasingly being used to supply asset condition data.
During a September 2020 webinar by Fluke Reliability, the 250 attendees—primarily maintenance and reliability professionals from around the world—were asked which of the five measurement methods they were using. Many, if not most, reported leveraging multiple methods.
For each method, the following percentages of attendees say they’ve deployed it:
- Vibration monitoring/analysis: 82%
- Thermography: 69%
- Oil analysis: 66%
- Motor testing: 54%
- Ultrasound: 36%
Not every organization needs to use all five methods. Some industries, machines, and situations require being alerted to the earliest possible failure indicators, but some do not.
Also, even companies with established condition-based maintenance routines do not use condition-based maintenance for 100% of their plants’ assets. And every organization has to consider not just an asset’s lifespan but also the resources, including labor hours and parts, required to prevent failures.
The balance between action and inaction is different for every asset and every plant. Frequent inspections can detect indicators of failure early on but require time and availability to carry out.
However, just as an effective maintenance and reliability program uses a mix of condition-based, calendar-based, and reactive maintenance methods, the P-F curve can be most beneficial when its use relies on a combination of modalities.
So, which should you use? Condition monitoring expert Colin Pickett offered this opinion during another recent Fluke Reliability webinar: “Any condition monitoring (CM) program will likely include vibration analysis since it’s the most common and cost-effective CM solution. But you should also have other data collection methods or tools to help determine the condition of your machines.”
Below, we detail each of the five technologies to help you make a smart choice. But first, here is some background on the P-F curve for those not as familiar with it.
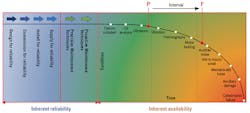
Figure 1. Inherent reliability measures the overall “robustness” of an asset or system; i.e., if you operate, maintain, and inspect a device as well as possible, you will be able to harvest all the inherent reliability. Availability assesses the performance of repairable equipment. Inherent availability is the “steady state availability,” factoring in corrective maintenance downtime.
Behind the P-F curve
The P-F curve was first introduced in 1978 by United Airlines engineers Stanley Nowlan and Howard Heap, who researched a Department of Defense study. Their study showed that repairing or replacing assets based on the condition was more effective than repairing or replacing assets based on age.
The “P” of the P-F curve refers to potential failure, which is when an asset experiences an identifiable change in its physical condition. The “F” refers to functional failure, which is the point at which the asset fails to meet a predetermined performance standard. At this stage, an asset is still running—but not the way it was designed to.
The above version of the curve, developed by Fluke Reliability experts, begins with Design for Reliability, Commission for Reliability, Install for Reliability, and Supply for Reliability. Past these earliest stages, the P-F curve moves to Precision Maintenance Techniques and Proactive Maintenance Techniques. Once an asset passes these stages, its condition is deteriorating, and failure signs can be detected. Again, failure itself does not mean that an asset has completely failed to function; that stage is not reached until catastrophic failure.
Choosing the right measurement techniques
Different indicators of failure can be detected at different times; the sooner that failure is detected, the more maintenance activities can prolong an asset’s life. However, the modalities that can detect failure the earliest tend to require sophisticated equipment and even diagnoses from external labs.
One way to determine which modalities to use for different assets is to refer to the OEM (original equipment manufacturer)—this can be a valuable source for learning an asset’s most common failure indicators. Later means of detecting failure can be done with simpler, non-intrusive techniques. Once the failure has been detected, and the cause has been identified, the asset’s next step can be determined.
It is possible to lengthen the time between when an asset is installed and when potential failure begins. With precision installation—ensuring that components have the optimal fit, clearance, alignment, and more—some common types of failures can be eliminated.
The five maintenance modalities and their uses
In rough order of their ability to detect failure modes, from earliest to latest, these are the modalities to use with the P-F curve:
Oil analysis can determine the presence of lubrication breakdown, overheating, component wear, and wear debris. These can be indicators of gear failure, bearing wear or failure, or cylinder wear. Components commonly tested for oil analysis include gearboxes, compressors, and other parts of rotating equipment.
Oil analysis is an advanced modality and can require a lab analysis for diagnosis. More straightforward screening—less conclusive—can be done through oil temperature measurements.
Ultrasound can detect sounds that human ears can’t hear or that even some tools can’t discern over a plant’s sounds. In addition to detecting leaks—from air, refrigerant, gas, or ammonia—ultrasound can pinpoint problems with valves, steam traps, bearings requiring lubrication, or potential electrical safety hazards.
Vibration is one of the most common and accessible modalities. It can indicate four of the most common mechanical methods of failure: imbalance, misalignment, looseness, and bearing failure. There are rarer failures, but these four account for the overwhelming majority of mechanical failures. Vibration meters offer the ability to screen less critical equipment while performing time-based maintenance. If a problem is identified, vibration monitoring or analysis can be performed.
After a machine has overheated to the point of a detectable elevated temperature, some damage may have already happened. Thermography, then, is recommended for time- or fault-based inspection routes. It can detect electrical and mechanical problems that have caused an asset to overheat, such as from misalignment, gearbox, or belt problems.
Motor testing also is leveraged for later detection of failures, and different types of tests can be performed on motors depending on whether or not they are in operation. Insulation degradation is one indicator of failure. This condition, along with power factor and harmonic distortion, are best detected while the motor is operating. Other tests look at a motor’s speed, torque, power, and efficiency.
Assets fail in different ways, and not all assets are equally critical to a plant’s production. Even within an asset, various components require different levels of urgency.
Therefore, combining tools and techniques is the most effective way to apply the P-F curve—one size truly does not fit all. Combined with useful data and analysis, the P-F curve can help organizations continuously improve their maintenance practices and increase their assets’ reliability.
For another look at the P-F curve and its impact on capacity assurance, please see this article.
John Bernet, CMRP, is a mechanical application and product specialist with Fluke Reliability and has over 30 years experience in the maintenance / operation of commercial machinery.
Gregory Perry, CMRP, CRL, is senior capacity assurance consultant with Fluke Reliability. He has been a Certified Reliability leader with nearly two decades of experience in maintenance and operational best practices.
Dries Van Loon, CRL, is sales and project manager, online condition monitoring, for Fluke Reliability, with 10 years of predictive maintenance experience. He became a certified ISO CAT 4 analyst in 2017.