A battery of standard online and offline analyses, including current signature analysis, demodulated current spectrum analysis and rotor influence check (RIC), are available for motor maintenance purposes. Current signature analysis (CSA), for example, has become the standard for detecting broken rotor bars by analyzing the sidebands around line frequency. Demodulated current spectrum analysis (DCSA) enhances the ability to detect broken rotor bars, especially on two-pole motors.
|
View related content on PlantServices.com |
The IEEE 43-2000 standard for insulation testing lists the polarization index (PI), a ratio of the measured resistance at 10 minutes divided by the resistance measurement at one minute. This ratio can be used for analyzing the general health of the motor’s insulation system. Plotting the resistance measurement at five-second intervals yields a graph called a polarization index profile (PIP). The resulting profile can then be used for additional analysis of the insulation system that can’t be obtained from the standard polarization index.
Power quality is a measure of the quality of the voltage and current supplying a motor or other load. By analyzing harmonics, voltage and current unbalance, over- or under-voltage and over-current conditions, a technician can determine what might be causing nuisance trips, voltage swells or sags, and other power system-related anomalies.
Here are three case histories describing how these techniques were applied to minimize the total cost of motor failures.
Finding broken rotor bars
Routine testing revealed that a 3,500-hp, 4,160-volt, 3,590-rpm, two-pole, AC induction motor displayed a 0.7419 dB peak level of the pole pass sideband, which exceeded the alarm set point of 0.3 dB. This suggested rotor bar problems. Vibration analysis, however, indicated a healthy motor. As a result of the conflicting diagnoses, we monitored the motor and trended the test results.
The motor was retested periodically during the next 11 months; at that time it was removed from service. The trended data revealed that the pole pass sideband increased 1,420% from 0.1814 dB at a running speed of 3,591 rpm to 2.5851 dB at a running speed of 3,592 rpm during the most recent 33 months the motor was online.
Test data during a three-year period showed an exponential increase in the pole pass peak levels, which typically is indicative of at least one broken rotor bar. The load variation should remain constant under normal operating and motor conditions. This motor displayed a 275% increase in the load variation, from 0.855% in to 2.345%, during the past 33 months.
The current spectrum taken when the motor was pulled form service showed an increase in sideband activity around the fundamental frequency, which also indicated broken rotor bars.
The motor was sent to a motor shop for disassembly. A visual inspection revealed that 22 of 51 rotor bars were either broken or cracked.
The root cause of the broken and cracked rotor bars was badly brazed joints between the bars and end rings from a rotor repair performed three years ago. The cost to repair the motor was $60,000, plus $30,000 in planned plant downtime. Had the motor run to failure, the cost would have been $170,000 for a new motor, plus $200,000 in unplanned downtime. In this case, the total savings were $280,000.
Polarization index profile
We applied a polarization index profile to an induced draft fan motor and developed the profile shown in Figure 6. Notice the low polarization index value and the quick initial rise time of the resistance to a relatively low overall value. These symptoms are indicative of an insulation system containing a significant amount of moisture. IEEE 43-2000 recommends an insulation resistance of no less than 100 megohms and a minimum polarization index value of 2.0 for this motor.
The moisture around the power cable entrance caused the low overall PIP and low PI value. A follow-up polarization index profile taken after the cables and components were dried was indicative of a motor with a healthy insulation system. When insulation systems become contaminated with dirt, carbon dust and the like, the PIP will display significant spiking throughout the test.
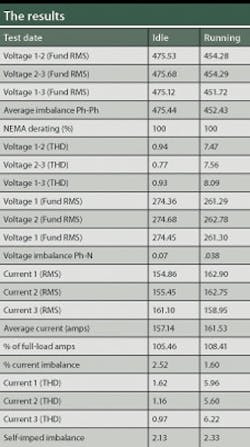
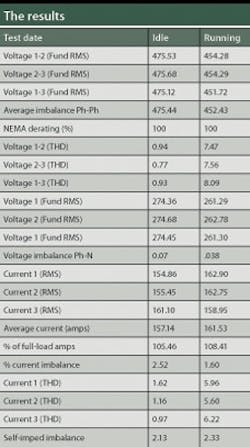
Test results with the winder down and with it running.
Power quality
Initial test data on a another motor indicated the voltage harmonics were greater than 5% and full load amps were at 107%. We researched the power distribution system to the motor control center to try to identify what might be causing the harmonics. A 13.8-KV, 2,500-KVA transformer was the feed for the motor control center’s 460-volt service handling eight motor lineups and five DC drives. The other DC drive power transformers in the plant supply power only to the DC drives and aren’t used in combination with AC motors. This suggested the DC drives might be generating the power-quality problems.
We ran further testing to compare the results when the winder wasn’t running and when it was. As shown in Table 12, when the winder wasn’t running, current harmonics (THD) were less than 2%, voltage harmonics were less than 1%, full load current was 105% of rated current, and the system voltage was 475 volts. With the winder running, current harmonics (THD) were greater than 5%, voltage harmonics exceeded 7%, full load current was 108% of rated current and a system voltage drop was 21 volts. These power-quality problems were reported to the appropriate department managers and then filed away.
A new microprocessor-based dock lock system for their eight-bay loading dock had been purchased and the electrical supervisor’s crew had installed a new power feed for the controllers. The vendor installed the lock system and it was under warranty. It worked fine most of the time, but sometimes the locks would open and close spontaneously. The controller manufacturer’s field service group (including their design engineer) had made several trips to investigate. They replaced several electronic cards and two complete controllers. The supervisor’s crew took the power for the new feed from the motor control center in question.
The electrical supervisor remembered the power quality report and wondered if the power quality issues might still be on the supply from the motor control center. After reviewing the report, the electrical crew installed line filters on the new controllers. The dock lock controller problem disappeared.
There are three tips to remember. First, a battery of online and offline testing can detect broken rotor bars. Online testing includes demodulated current and current signature analysis. Offline testing includes a rotor influence check, which graphically depicts broken rotor bars. Second, a modification to the standard polarization index test can provide a better analysis of the health of insulation systems. Third, power quality can be used to analyze a power system and correct the harmonic problem that motor drives can cause.
David L. McKinnon is a project manager at PdMA Corp. Contact him at [email protected] and (813) 621-6463 x 125.
Figure: PdMA Corp.

