Vibration spectrum analysis 101: Tips for getting started

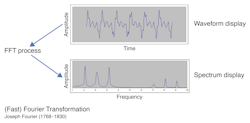
Once the purview of technical specialists, the need to analyze machine vibration data has become commonplace for engineers, maintenance planners, facilities managers, and administrators. The reasons for this include an increasing reliance on vibration data for managing machine reliability, coupled with the sheer volume of data streaming in from the remote sensors and cloud-based monitoring systems that make data collection more practical than ever (see Figure 1).
What hasn’t changed is the need for the knowledge and skills to turn that growing volume of data into decision-driving information. There have been advances in artificial intelligence (AI) to process vibration data. But in critical applications that impact the bottom line, professionals know decisions on machinery repair and replacement need manual confirmation of analysis results.
To move forward with confidence, stakeholders need basic analysis knowledge and skills to interpret vibration data. With that in mind, this article presents some basic information about vibration spectrum analysis, along with some tips for getting started.

Getting started with the vibration spectrum
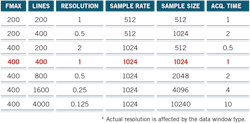
The vibration analyst’s most basic tool is the vibration spectrum. The spectrum graphically illustrates the relative amplitudes of the frequencies present in a vibration signal (see Figure 2). Basically, it is a “bar graph” of the frequencies, with hundreds of individual vertical frequency “bars” across a range of frequencies. Most spectra display only a single dot for the highest amplitude in each frequency bar, so the graph appears as a jagged line reflecting those peaks. The highest frequency on the horizontal axis is called the fmax, and the number of bars in the graph is known as the “number of lines of resolution.”
Setting the resolution and fmax. Setting the number of lines of resolution and the fmax are essential first steps for the vibration analyst. For most common analysis tasks, 400 lines of resolution is adequate, while more specialized tasks may require higher resolution.
Setting the proper fmax is a little more complex. An fmax of 400 Hz (24,000 CPM) is adequate for evaluating common machine faults, but rolling element bearings and gear mesh can generate vibration at much higher discrete frequencies (up to 5 kHz). A good practice is to survey the machine first with a 5 kHz fmax to identify any significant amplitudes at higher frequencies. If none are present, set the fmax to 400 Hz to analyze common machine faults. The selections made for Fmax and resolution will impact data acquisition time and storage requirements (see Figure 3).
High-frequency detection modes. Many vibration analysis instruments provide a special high-frequency detection mode for evaluating vibration energy from rolling element bearings, gears, and similar mechanisms where friction is a factor. Some common proprietary detection modes include gE, gSE™, PeakVue™ and SPM™. Some analysts will use one of these detection modes to assess the need for recording higher fmax spectra.
Best units for general spectrum analysis. Several vibration standards (ISO 10816, IEC 60034, NEMA MG1 and EASA AR100) use velocity amplitude units for general acceptance criteria. Although amplitude units of acceleration or displacement may apply for some special applications where high- or low-frequency signals are a concern, velocity units are best for general spectrum analysis. Velocity units may be represented as inches/sec pk, mm/sec pk, or mm/sec rms. Be sure to note the proper units on any printed data.
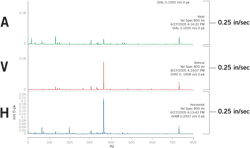
Setting the amplitude scale and display format. Most vibration analysis instruments and software will default to auto-range the amplitude scale for spectra displays. While this makes it easier to distinguish individual peaks in the spectrum, it makes it harder to visually compare spectra from different machine locations when assessing machine condition. A good practice for overall evaluation of machine condition is to manually set the same amplitude scale for all spectra. Also, since it is common to record spectra for the horizontal (H), vertical (V) and axial (A) directions at each bearing location, it is helpful to standardize the display format to three spectra per page with consistent H-V-A orientation (see Figure 4).
Use of the cursor tools
Printed (or digital image) spectra can be useful for preliminary evaluation of machine condition or for report documents, but vibration analysis instruments and software have powerful cursor tools that hold the secret to accurate assessment of specific machine faults. Most systems have both a harmonic cursor and a sideband cursor tool, and these are primary tools used for spectrum analysis. By identifying families of peaks in the spectra, the fundamental frequency of each family of peaks will strongly suggest possible fault sources.
Harmonics cursor tool. This tool can identify integer harmonics of rotating speed (1xRPM, 2xRPM, 3xRPM, etc.) that often indicate mechanical looseness or shaft alignment faults, depending on the pattern. For example, half orders are typical of a rub. Peaks related to line frequency are obviously electrical in nature. Of course, a dominant 1xRPM peak often results from rotating mass imbalance.
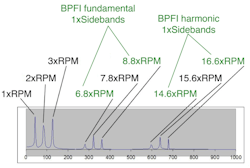
Sideband cursor tool. Sidebands around a dominant peak in the spectra indicate modulation of that dominant peak. A classic example of modulation is a cracked inner race of a low-speed ball bearing. The vibration amplitude modulates at the ball pass frequency inner race (BPFI) bearing fault frequency as the crack rotates into and out of the load zone. Some instruments and many software analysis programs have sideband cursor tools to help identify sideband frequencies.
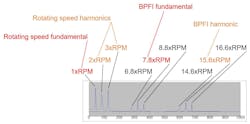
Figures 5 and 6 show a spectrum from the cracked inner race of a low-speed ball bearing. As shown in Figure 5, the basic cursor tool or harmonic cursor tool would identify the 1xRPM, 2xRPM, and 3xRPM peaks in the spectrum as a simple family of harmonic peaks that might be due to slight looseness or perhaps a slight misalignment condition. But the other higher frequency peaks in the spectrum are clearly not harmonics of 1xRPM. The basic cursor tool would identify the 7.8xRPM peak as matching the calculated BPFI.
Similarly, as shown in Figure 6, the harmonic cursor tool would identify the 15.6xRPM peak as the second harmonic of BPFI. But the remaining peaks in the spectrum are not harmonics of either the 1xRPM fundamental or the BPFI fundamental frequencies. The sideband cursor tool would be used to identify these additional peaks as 1xRPM sidebands of the 1xBPFI and 2xBPFI peaks.
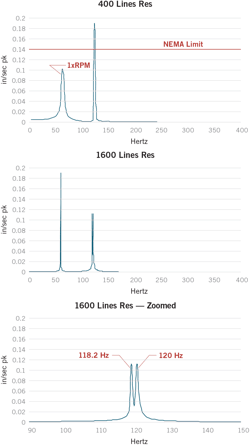
Beyond an initial assessment of machine condition, it often is necessary to take a more accurate look at specific frequencies in the spectrum. Expanding the display (zooming in) does not increase the resolution of a spectrum. More accurate determination of the frequency of a peak requires recording a new spectrum from the machine at a higher resolution. Both the fmax and the lines of resolution settings directly affect how accurately the frequency of a peak is indicated. Most spectrum analyzers have 3200 lines of resolution available; some have even more. High-resolution spectra are often used to separate 2x vibration on 2-pole induction motors, where 2xRPM and 2x line frequency (2xlf) are very close together. Figure 7 illustrates the effects of increasing the resolution and zooming the spectrum display.
A practical example illustrates the usefulness of high resolution for separating electrical vibration from mechanical vibration. A critical 2-pole motor was exhibiting high axial vibration at what initially appeared to be 2xRPM. Common diagnostic charts and references suggested the likely cause was shaft misalignment. But a subsequent high-resolution (3200 line) recording of the spectrum found the peak actually occurred at 2xlf, an electrical source. Further testing identified a resonant condition in the motor end bracket at the 2xlf (7200 CPM) frequency. Had the initial diagnosis of shaft misalignment been accepted, much time and effort would have been wasted trying to correct a non-existent mechanical problem.
Resonance and natural frequencies
The above example also highlights the importance of understanding resonance and natural frequencies. A natural frequency is a frequency where a component or structure has little resistance to vibration due primarily to its stiffness or mass. Since all machine components have stiffness and mass, they all have natural frequencies.
Resonance occurs when the frequency of a vibratory force (imbalance, blade pass, etc.) is close to a natural frequency, causing an increase in vibration amplitude, usually in only one plane. Resonance is a common problem on many machines that exhibit high vibration at a single frequency, especially when that high vibration occurs in only one plane. A complete set of vibration spectra (i.e., H-V-A for each machine bearing) may directly indicate a resonant condition and the need for further vibration testing.
Four stages of rolling element bearing failure
Vibration analysis of rolling element bearing condition is common. (For instance, the spectrum that illustrates harmonics and sidebands in Figures 5 and 6 was from the cracked inner race of a low-speed ball bearing.) Despite the wide variety of bearing applications and operating conditions, there are some well-established techniques for identifying stages of a failing bearing.
At the earliest onset there are not specific flaws in the raceways and rollers. Rather, increased metal contact and friction generate more high-frequency energy, and proprietary detection modes including gE, gSE™, PeakVue™ and SPM™ will indicate the increased amplitude. As actual raceway and roller damage occurs, higher harmonics of specific bearing fault frequencies become evident in the spectrum (i.e., inner and outer race roller passing frequencies, roller spin frequency, and cage rotating frequency). As the geometry of the bearing components deteriorates, lower harmonics of the fault frequencies appear, while increased random frequency vibration raises the noise floor of the spectrum. By the final stage of failure, the bearing geometry has disintegrated, and fault frequencies may be barely discernable, smudged together with a greatly increased noise floor.

This discussion of the stages of bearing failure reveals the need for a comprehensive approach to using vibration data to evaluate machine condition. Multiple spectra from various locations on the machine and trend data collected over time provide a good basis for analysis (see Figure 8). Attempting to diagnose a problem from a single spectrum often leads to mistaken conclusions.
Fundamental skills for vibration technicians include an understanding of spectrum analysis, how to set data acquisition parameters, and how to use the cursor tools available in an instrument or software program. EASA, the Vibration Institute (www.vi-institute.org), and several independent providers offer vibration analysis training resources that cover the basics presented in this article, as well as more complex aspects of vibration analysis familiar to vibration analysis technicians. But understanding the basics is essential for everyone who is directly involved in rotating machine condition and performance issues.
About the Author
Eugene Vogel
Eugene Vogel is a pump and vibration specialist at EASA, Inc., St. Louis, MO; 314-993-2220; (fax) 314-993-1269; www.easa.com. EASA is an international trade association of more than 1,700 firms in nearly 70 countries that sell and service electromechanical apparatus.