In brief:
- There are many software tools, spreadsheets and other freely available tools that one can use to make a sound judgment about the repair/replace decision for electric motors.
- The decision should be based on simple payback, the ready availability of a spare motor, relative reliability for a spare and the rewound motor, and other factors, taken separately or in combination.
- The reliability or maintenance engineer should provide input into the repair/replace decision to ensure considers the motor’s intended application.
In the 1990s it was popular to base repair-versus-replace decisions on energy consumption and reduced efficiency through the repair process. This meant considering the efficiency of a new energy- or premium-efficient motor, operating hours and load against the original machine so as to determine the simple payback. If the payback was less than a specified time, such as two years, the replacement was considered economically viable.
However, energy is only one aspect. Other considerations include:
- The availability of a replacement
- The number of times repaired
- What was repaired and how it was done
- Machine reliability
- General condition
- The effect of downtime on profitability
- The number of inventoried spares.
The first question usually asks which size is the cutoff for a motor repair. The answer: It depends.
Energy decisions
[pullquote]How do you weigh the relative values of repairing versus replacing a motor from the standpoint of energy consumption? There are software tools, spreadsheets and more resources dedicated to this type of decision-making, including the U.S. Department of Energy’s MotorMaster Plus software (www1.eere.energy.gov/industry/bestpractices/software.html). Each of these methods compares the efficiency of the original motor with energy assumptions following the repair process and the new, more efficient electric motor. The result normally is expressed as a simple payback for which the motor owner must decide if it’s of value. In the past, the normal threshold was two years or fewer.
The calculation is quite simple. You need to know motor horsepower, load (or average load) and the original efficiency, energy and demand costs. The numbers are plugged into a standard set of formulae, as follow:
To find the power difference, use Equation 1.
P = 0.746 * hp * L *(1/effo -1/effn) (Eqn 1)
Where:
P = power difference (kW)
hp = horsepower
L = load (decimal fraction)
effo = original efficiency (decimal fraction)
effn = new motor efficiency (decimal fraction)
To find the demand charges, use Equation 2.
D = 0.746 * hp * 12 * C (Eqn 2)
Where:
D = demand charge ($)
hp = horsepower
C = monthly charge ($/kW/mo)
Then, use Equation 3 to determine the usage charges:
U = 0.746 * hp * T * R (Eqn 3)
Where:
U = usage charges ($)
hp = horsepower
T = hours of operation
R = utility rate ($/kWh)
Finally, use Equation 4 to find the simple payback.
PB = Diff / (D + U) (Eqn 4)
Where:
PB = simple payback (yrs)
Diff = cost difference to repair or replace ($)
D = demand charge ($)
U = usage charges ($)
Practical example
Let’s assume a decision needs to be made about an older, standard-efficiency motor rated at 50 hp, 92.5% efficient, 80% loaded, with $0.12 usage and $12/kW demand charges for 4,000 hours per year to be replaced with a 95% efficient motor. Assume that the difference between the motor replacement cost and repair cost is $900.
According to the U.S. Department of Energy’s publications, you can expect an average of 0.5% efficiency reduction per rewind using standard motor repair practices. Alternate rebuild practices can avoid this reduction.
The power difference will be:
P = 0.746 * hp * L *(1/effo -1/effn)
= 0.746 * 50 * 0.8 *(1/0.925 -1/0.95)
= 29.84 * (1.0811 – 1.0526)
= 29.84 * (0.0285)
= 0.85044 kW
The demand charge will be:
D = P * 12 * C
= 0.85044 *12 * 12
= $122.46
The usage charge will be:
U = P * T * R
= 0.85044 * 4,000 * $0.12
= $408.21
The simple payback will be:
PB = Diff / (D + U)
= $900 / ($122.46 + $408.21)
= $900 / $530.67
= 1.7 years
Because the replacement cost is less than the two-year threshold, this motor would be replaced. Also, if the motor efficiency is assumed to be reduced by 0.5% and the carbon output is 0.909 tons/MWh, then the energy and environment decision might be improved. Using the above, the original motor would be assumed at 92% efficient, or a total savings of $637 per year, or a simple payback of 1.4 years. The greenhouse gas emission reduction would be (1.02 kW * 4,000 hrs * (1 MWh/1,000 kWh) * 0.909 tons/MWh = 3.7 tons/year carbon. The combination of both numbers makes the replacement decision even more palatable.
Availability of replacement
On the other hand, if the motor isn’t available because of some special part of its design or the delivery lead time, one might opt to repair the motor, regardless of the energy effect. This would be classified as a production-related decision versus a decision concerned with energy or the environment. The replacement or repair cost of a production-related motor that has no immediate spare often is far less than the lost production income.
For instance, if a down machine is costing a company $1,000/hr for two shifts per week (80 hours) and the new $4,000 motor won’t arrive for two weeks, but the motor might be repaired within three days at an expedited cost of $5,000, the economics of repair-versus-replace is straightforward: cost of new, including lost production is $164,000; cost of repair, including lost energy opportunity for five years (using above numbers) is $56,185.
(48 hr * $1,000/hr) + ($637/yr * 5 yr) + $5,000 = $56,185.
The difference between all of the cost associated with the new motor versus the repair is $107,815, which should not be acceptable. This, of course, doesn’t include orders lost because of late deliveries.
In these situations, the energy and environmental impact is ignored and repairs might end up costing many times the price of the new machine. In other extreme cases, the existing motor might be “patched” to operate long enough for the replacement motor to arrive. These instances often are the result of a reliability-based replacement decision.
Reliability-based replacement
Regardless of the motor, as a component, cost and savings, decisions might also relate to the machine’s reliability or perceived reliability. For instance, if the motor has been rewound multiple times using burnout ovens, or the motor frame has been damaged in the application, or some other reason brings the long-term reliability of the motor into question, a replacement decision might be made. Often companies have guidelines such as a limit to the number of rewinds a motor might have during its lifetime. However, this foregoes a few opportunities that might be performed through the repair process.
In the case of the number of rewinds, which often is thought to be a maximum of two or three, a practice might be implemented in which the core losses before and after coil removal are monitored during the rewind process. There’s a core loss limit of about 6 W/lb for a standard electric motor. However, most new electric motors have a core loss of 2 W/lb to 3 W/lb.
Motor repair standards such as IEEE Std 1068-2009 allow for as much as a 20% increase in core loss before a motor repair shop must report an increase in core losses. However, for reliability programs, it’s important to obtain this information regardless of this standard practice. The increase can be monitored and a decision should be made to stop rewinding a motor once the cumulative losses result in an increase of 50% to 100%. It should be noted that an increase in core losses of just 20% results in a reduction of efficiency from 0.3% to 0.7%, depending on the core design and materials.
As the core loss increases, so does the amount of heat the stator core produces during operation, as well as the current draw as more energy is used to feed the core losses. This often can be observed as an increase in current draw following a motor repair.
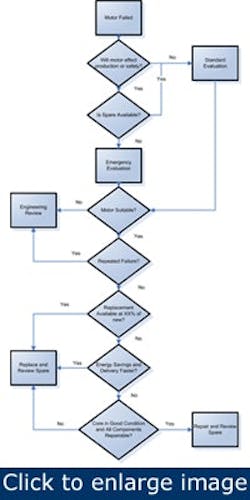
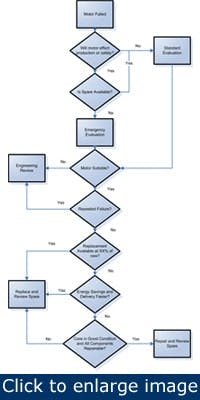
Figure 1: Repair-or-replace decision tree
Another item to monitor following each repair is any increase in soft foot. This is an indicator that temperatures have caused the motor stators to warp, which can result in poor air gap (static eccentricity). For both eccentricity and core loss, compare the results to the first readings taken and referenced to IEEE Std 432.
Cost-based replacement
A relatively common guideline is to repair motors only if they don’t exceed a range of 50% to 80% of new. This method often is used in cases where the buyers want a simple rule to make a decision. The result often is that the full lifecycle costs associated with a machine aren’t realized. This methodology is usually combined with availability and reliability, but not often. Unfortunately, this practice eventually leads to comparisons against cheap replacements such as replacing severe duty motors with open drip proof or going from a reliable manufacturer to a less reliable manufacturer.
To be successful, this approach must be used in combination with the other methods described above, as well as ensuring that original specifications are met or an engineering review confirms it will have the original level of reliability or better (Figure 1).
When considering repair versus replacement of an electric motor, there are more items than energy and environmental savings to consider. While this has been a primary focus during the past two decades and led to some poor decisions, there are additional considerations such as the motor’s impact on production, spares in inventory, motor reliability, suitability and cost-based replacement. When considering repair versus replacement, it’s important for the reliability or maintenance engineer and the buyer to ensure that appropriate decisions take place that consider the complete context of the application.
Howard W. Penrose, Ph.D., CMRP, is vice president, engineering and reliability services at Dreisilker Electric Motors in Glen Ellyn, Illinois. Contact him at [email protected] and (800) 922-1882.

