As facility manager for Schneider Electric’s Huntington and Peru, Ind., plants, John Troyer is a busy man. He knows energy efficiency is important and his bosses have put it high on their long list of priorities, but he can’t devote a lot of time to monitoring and managing it. So he’s glad that it usually takes less than a minute to open and review the e-mail message his system sends him each day, summarizing consumption and highlighting anomalies.
But one morning, he was dismayed to discover that the plant set a record peak load. Opening his energy monitoring dashboard, he narrowed the time frame to a few hours the previous afternoon. Production rates or weather didn’t explain the spike, but he saw that it occurred on just one of the 17 power transformers in the Peru plant. He called the Peru maintenance supervisor, who said he’ll bring it up in the morning meeting.
The meeting attendees offered various possible explanations, including the monthly test of a back-up air compressor. Troyer brought up and reviewed several months’ history and sure enough, he found corresponding peaks on that transducer over time. He asked the maintenance supervisor to reschedule compressor testing to an off shift, saving the plant $10,000 during the next four years.
Like high blood pressure
Inefficiency can kill you. “Energy efficiency is so big, but it’s a silent killer,” says John Murphy, director, solution marketing, for enterprise asset management (EAM) systems at Infor (www.infor.com). “You’re getting the work done, but you’re closer to the edge than you might realize. Like high blood pressure, it’s not overt but it can kill you. You can’t ignore it.”
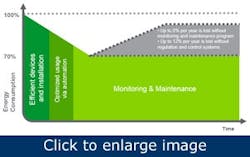
Shaving a peak might be small potatoes compared to the savings a plant can see from a reworking a compressor room, replacing a boiler or updating lighting. But, once those high-visibility projects are done, monitoring is not only an essential tool for further improvements in energy efficiency, it’s also necessary to prove and maintain the project savings (Figure 1).
Figure 1. Without control, monitoring and maintenance, as much as 20% of the value of energy-saving technologies will be lost over time. (Schneider Electric)
The cost of energy in the United States is predicated to rise as the global demand for natural resources continues to increase. “Add to this the pending U.S. legislation that might require U.S. manufacturers to measure and control their carbon dioxide emissions under a cap-and-trade system, and the cost of producing steam could soar,” says Jack Roushey, global products marketing manager for flow and level products, Honeywell Process Solutions (www.theoptimizedplant.com). “To manage rising energy costs, manufacturers will need to ensure that production processes are lean and monitored affectively.”
Fortunately, the ability to gather, analyze and act on energy data is rising as fast as the need. Wireless is becoming common, meter costs have come down and we have the protocols to make monitoring reasonable for a large number of industrial facilities. “Companies used to just monitor main breakers, points of common coupling, large areas and reselling points,” says Mark Feasel, director, Energy Solutions, Schneider Electric (www.schneider-electric.us). “Now, with automotive leading, they’re metering to line levels, and they’re empowered to go deeper.”
[pullquote]Companies need to track W.A.G.E.S. — water, compressed air, gas, electric and steam — by facility and by shift not only to reduce consumption, but also to optimize asset performance and improve reliability. “A typical facility has $20 million in power distribution assets for every $1 million per year it spends on electricity, and transformer loadings affect the life of those assets,” Feasel says. “You can avoid the costs of downtime and bad product by monitoring power.”
Knowing where the energy is going also allows plants to take advantage of demand reduction programs. As we adopt more Smart Grid technology, the way you use energy will more profoundly affect what you pay for it. It won’t be all based on one tariff for a large class of consumers. Your bill will be tied to your individual profile, and understanding it will allow you to use energy when the utility wants you to.
In Illinois, ComEd’s Rider capacity-based load response (CLR) demand-reduction program expects to pay $37.24 per kilowatt that enrolled companies promise to reduce, if called upon, for two to eight hours per incident and as many as 15 events per year, whether or not they are actually called upon to do it.
And as always, plants operate under the prospect of increased regulation. “So far, energy cost and efficiency are the drivers, not CO2,” says Murphy, but under cap-and-trade, CO2 becomes cost.”
{pb}Hook up instruments
“If we don’t measure, we cannot manage, so we have to have good instruments,” says Henry Petersen, business manager, Endress+Hauser (www.us.endress.com). “Measure flows and volumes of air, gas, liquid, power, steam — then we can have a database.”
The first place to look for instrumentation is on the equipment you already have. “People commonly have monitoring capabilities they’re not using,” says Feasel. Monitors are specified into recently acquired equipment and facilities, but not networked back. “Connecting them can be very cost-effective.”
For electricity, 17 circuit monitors on switchgear at Troyer’s Peru facility output voltage and current readings to a unit that calculates variables and makes them available to Web tools over Ethernet. The same devices support data collection for gas, steam and water usage. “Energy management software lets you look at history by time frame,” Troyer says. “You can zoom in on a time frame, right down to a power quality event and see the waveforms. You can set alarms.”
Sheboygan Regional Wastewater, Sheboygan, Wis., operates five facilities serving 60 million people. Energy consumption totals $400,000 per year, primarily electrical, but some natural gas. “Over the past eight years, electrical rates have gone up 75%, and gas went up 105% before 2009,” says Dale Doerr, Sheboygan superintendent. “We can’t control the cost but we can control what we use.” Power is 100% monitored on incoming lines, on each motor control center [MCC] and by building on blower equipment. “For every change we make, energy is a consideration,” Doerr says.
The facility uses Eaton Motor Insight overload and monitoring relays. “For across-the-line loads, today’s overload relays are able to do more than protect the motor,” says Adam Krug, product manager, Eaton Corp. (www.eaton.com). “The Motor Insight relay allows customers to see consumption at the specific load and facilitates real-time equipment monitoring.” Using industrial protocol communications and a central SCADA system, Sheboygan can catch increased consumption in real time, which has allowed it to avoid downtime as well as control consumption.
Among the W.A.G.E.S., water, compressed air and steam are best measured with a strategy that detects leaks. Steam is most complex because it calls for mass flow measurement, but flow restrictions and pressure drops are concerns with any fluid measurement. Traditional orifice plates should be used only with caution. Under normal operating conditions, an orifice plate requires a nominal 5 psi of pressure drop to function. “Upwards of 60% of the pressure drop across an orifice plate is unrecoverable, contributing to the overall cost to operate the steam measurement system,” says Roushey. “Newer meters, such as the vortex meter, operate with less than 1 psi of pressure drop, a substantial benefit when accounting for the cost of producing steam.”
Modern steam meters also provide additional benefits, such as converting velocity into mass flow such as kilograms or pounds per unit time. Mass flow measurements are useful for leak monitoring. If steam is losing heat as it travels through the process line, monitoring volumetric flow rate will be ineffective as changes in the temperature and pressure affect the volumetric flow rate. For example, 1,000 cubic feet measured off the boiler at 25 psi isn’t equivalent to the same reading measured downstream, where the pressure is now only 20 psi.
But don’t be daunted by the intricacies of instrumentation. “The notion of measuring energy has been around, and many companies have technologies in place,” says Murphy. According to an Aberdeen study, 50% of manufacturers say they already are collecting energy information.
“It’s not very costly to bring it into a system,” Murphy says. “It’s really about connecting the dots to make sense of it. Once we have the information, what do we do with it?”
Analyze the data
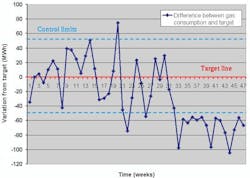
Figure 2. The first step in data analysis is to establish base loads and control limits, so you can know when a rise or reduction in consumption is significant. (Endress + Hauser)
“Collecting information isn’t enough,” says Feasel. “The purpose of a meter is to formally deliver information to a human or system that can do something about it. You have to make the information available to the stakeholders who need to know if it’s good or bad, and how they compare to others.”
A basic approach is analyzing consumption at 15-min. or 30-min. intervals. Understand peak loads that determine power bill demand charges and establish base loads so you can correlate them with production, weather and occupancy. Then you can establish control limits and know when a rise or reduction in consumption is significant (Figure 2).
What is normal?
Sophisticated energy management systems pull in production and weather data so users can compare last year to this year, and factor in weather and production levels to find opportunities. Troyer uses his to pull up records, do trend analysis, understand base loads and ask questions. “You might see 30% load on one weekend and 20% on another,” he says. “How well is the plant being shut down? What’s running on off shifts? How consistent are your shut downs? It’s been very helpful.”
{pb}It’s useful to relate energy consumption to driving factors, for example, heating energy per degree-day, energy per ton of product or electric power for lighting compared to hours of daylight. “These are generally called specific energy consumptions,” Petersen says. “Monitoring them allows you to determine if a certain process is drifting over time — if it is becoming more or less efficient.”
Such a drift might have a number of causes, such as increasing compressed air leaks, heat exchanger fouling or poor steam trap maintenance.
Detect cumulative effects
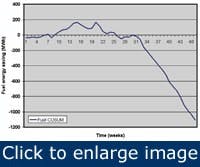
Figure 3. A cumulative sums (CUSUM) chart tracks consumption over time to help spot long-term drifts or the results of changes. (Endress+Hauser)
“We can total these differences over time in a cumulated sums [‘CUSUM’] chart,” Petersen says. “This chart acts like a bank account: If the process becomes less efficient, the CUSUM chart will run away from the zero line.” Figure 3 shows a process that has become more efficient: an economizer has improved a steam boiler’s efficiency. We can read directly from the chart that the economizer saved 1,100 MWh of energy over 15 weeks.
Some computerized maintenance management software (CMMS) systems now can track and display energy information. “We collect and present it visually, for example, on a floor plan in Maximo,” says Rich Caplow, director, product management, IBM Tivoli Software. Color-coded contours represent information, such as green/red/yellow for OK, hot or cold. Equipment can be treated similarly, with thresholds for tripping alarms and sending a technician. “It’s like condition monitoring, but based on power consumption,” he says.
The display is supported with an asset and service management database, so if a piece of equipment shows red, you can click on it and pull up asset information such as maintenance records, operating hours, warranty status, nameplate data, etc. “You also can determine the equipment’s criticality against the production schedule, generate a work order or trouble ticket and set its priority, dispatch a technician and track work status,” Caplow says. “It automates power consumption management.” To support these capabilities, the CMMS interfaces with building control systems, supports OPC and accesses control system historians.
But all this information is of no use if you’re too busy to look at it. That’s one reason Troyer likes his daily summary e-mails. “If everything’s OK, it takes 10 seconds to review,” he says. Each month, he gets a comprehensive report. “I spend some time on the monthly report, where I look for trends and opportunities. With the tools, it takes me an hour or two. It depends on how complex the plant operations are — how steady-state.”
At Sheboygan, energy information is displayed on the SCADA monitors and shown to employees. “When they see something out of the ordinary, they ask questions,” says Doerr.
Save energy
Understanding correlations, detecting changes and receiving notifications are all good, but no energy is saved until you make a change. The range of possibilities is too large to cover here, but our experts highlighted some specifics.
To save money on power bills, “Reactive power is where you can make the most gain,” says Craig Nelson, product marketing manager, Sinamics drives, Siemens (www.siemens.com). “Correct power factors to one or to whatever is needed using active front end [AFE] drives. These also reduce harmonics, which reduces heating and wasted power.”
Take advantage of process information to diagnose energy losses. For example, flow, temperature and pressure measurements on steam lines can help distinguish between insulation and leak losses. “Any leakage in the line normally results in the loss of pressure and flow,” says Roushey. If it costs $5 to produce 1,000 lbs of steam at 100 psi, a half-inch downstream leak wastes 835,000 pounds of steam per month, equivalent to $4,175 per month ($50,100 annually).
“Monitoring temperature allows you to monitor the effectiveness of the insulation,” Roushey says. “A temperature drop, along with a decrease in flow rate or pressure, suggests leakage. Temperature loss without a noticeable change in flow rate can be an indicator that there are gaps in or insufficient layers of insulation surrounding the pipe.”
{pb}In the United States, most boilers are 20 years old or older. “A little TLC will help them reduce energy consumption,” says Petersen. “Check the water pipelines. Some 2-in. or 3-in. lines are effectively choked down to ½ in. or ¾ in. by rust or sediment.”
Overall, experts’ estimates of potential energy savings range from 5% to 30%. “As a rule of thumb, companies save 5% to 15% of energy costs,” Petersen says. “We have some over 15%, especially on steam and compressed air.”
Troyer says ROI depends on what you make of it. “If you put it in and use it, you can get very fast payback — you can get it in six months,” he says. “You’ll be able to take advantage of some opportunities right away — ROI is instant when you find things running on an off shift. For some, you’ll have to buy equipment. On one site, we’re saving $300,000 to $400,000 per year from the projects we’ve done over the past four years, with about a $1.2 million total spend.”
By detecting malfunctioning equipment, improper control and out-of-bounds conditions, “There’s a potential for 10% to 30% energy savings,” says Caplow. It’s all about doing a better job of understanding where the energy is going.”
Save the day
Green initiatives undertaken by Forest City Gear as of Jan. 27, 2010:
Building and grounds
- Changed our lighting system from T-12 to T-8 using 25, 28 and 32 watt lamps.
- Tinted windows with low-E film
- Replaced several heating/AC units with high-efficiency units (Energy Star)
- Installed large ceiling fan in plant
- Installed programmable thermostats throughout the building
- Re-roofed the front office to increase the amount of insulation
- Purchased sun reflecting covers for our skylights
- Replaced less efficient air compressors with larger, more efficient units
- Strategically planted shade and fruit trees, shrubs, and plants all around our grounds
- Installed Oberland oil filtrate/cooling unit for gear grinding, using outside air for chilling the oil anytime ambient air temperature is 50°F or below
- Approximately six acres of Forest City Gear property are undeveloped
- Created a trellis on the south side of building with vines that add summer shade to assist cooling
- Reduced our energy consumption through better efficiency with new equipment
- Created green plant area in middle of shop
- Installed V-Blox power protection/power factor correction system (Energy Star)
Operational
- Turn off lights during lunch period
- Turn on/off lights as required for bathrooms, lunch room, conference room and warehouse
- On weekends and major shutdowns, we adjust heat/air to minimum needed
- Regular checks for air leaks in building (door/dock seals, cracks/opening in corners etc.)
- Conform to the recent European Union (EU) Reach regulations regarding chemicals
- Regularly check for compressed air leaks
- Implemented and follow the principles of Lean Manufacturing
Recycle
- Spin oil out of chips
- Separate various types of scrap metal
- Cardboard and mixed paper
- Aluminum cans
- Plastic bottles and shrink wrap
- All used oil and mop water
- Replaced bottle pop machine with aluminum cans
- Reuse most all received packaging dunnage, except for Styrofoam peanuts which we recycle locally
- Donate/recycle printer cartridges to Keith School
- Donate documents to School of Hope for shredding/recycling
Miscellaneous
- Both company cars are hybrids
- 2006 diesel truck for delivery
- Recognized in 2008 as “Green” business leader by the Winnebago County Green Business Coalition
- Received in 2009 the prestigious Outstanding Corporate Friend of the Environment award from Keep Northern Illinois Beautiful (KNIB)
- Use recycled paper products for administrative use
- Main copy machine is energy star-rated
- Eliminated bottled water service for drinking and now used filtered tap water
- Support local “Green” organizations
- Paychecks are paperless
But saving energy is only half the story. Energy monitoring also can improve reliability and prevent the downtime that can ruin your day.
Sheboygan Regional Wastewater installed Eaton Insight modules to monitor the power used by its fixed-speed pumps. The module replaces thermal overloads, detects a rising load before it trips and reports back through the SCADA system.
“People think that VFDs are the only way to save, but when you run across the line, you can detect problems and rectify the situation before you incur extra energy costs,” says Steve Meifert, controls engineer, Sheboygan. “We recognize problems almost immediately.”
On one pump, Sheboygan saw the power rise to 80 kW from the normal 60 kW. “We found rags and stuff causing drag on the impeller,” Meifert says. “Insight gives me more information about the motors and we can get it remotely, without having to go out there and measure. We have protection for over- and under-currents, we can compare pumps, check loads and flows, and detect problems with the units.”
Without monitoring, “We might have detected the problem by increased runtime hours because the pump was less efficient,” says Ron Hicks, Sheboygan maintenance supervisor, “but that would have been hard to notice, as our loads normally fluctuate with the weather.”
When instrumenting electric power, it’s useful to measure harmonics as well as power factor and kVA. “Harmonics are tougher to measure than power factor,” Nelson says. “Measure them with special equipment at the point of common coupling. Get a baseline and check them now and then. IEEE 519 tells how to limit them.”
Troyer’s PowerLogic devices give information on power quality as well as power use. Sags, surges, total harmonic distortion, power factor, demand and unbalance are tracked for each transformer feed.
Reliability was the prime motivator for a power audit at Forest City Gear (www.forestcitygear.com). The gear manufacturing facility has modern equipment with computerized control systems. “We were looking for energy efficiency, but also why our equipment was failing prematurely. Power quality affects microprocessor-based equipment, including ballasts. When 30,000 hour bulbs last 6,000 hours, it raises maintenance costs and the equipment ends up in a landfill.”
An audit by Total Energy Concepts (www.totalenergyconcepts.com) looked at the distribution, drives and motors. “We verify voltages and measure real-time power factors under load,” says Doug Overbold, president, Total Energy Concepts.
“Most of the motors will be running in the 60% to 70% efficiency range, some in the 80s,” says Scott Hembrough, senior area director, Total Energy Concepts.
“You’d think new equipment would be better but the fact that it’s new is no guarantee. You can’t optimize the motor until it’s in the building.”
Forest City installed transient surge suppressors by V-Blox. “We bring power factors to 0.95 to 0.99 on larger equipment — 15 hp and up — to pick up line losses,” says Dave Mulvaney, president, V-Blox (www.v-blox.com).
“90% of consumers have no idea what the demand charges are on their bill,” says Overbold. “We expect them to see 10% to 20% savings, but the real savings are in uptime and reliability.”
Blending energy monitoring and asset management is still in its infancy, Murphy says. “The 15 or 20 companies that are doing it are early adopters — visionaries.”
Save the world
When contemplating technologies that can save energy and improve reliability, it’s often easier to make sweeping statements than to tackle an implementation. Start with a walk around the plant on an off-shift or weekend. “Visit your compressors and boilers,” says Petersen. “Why are compressors running when there’s no production? Look and listen. Feel the leaks.”
Existing instruments might not have connectivity through Ethernet, PLCs or controllers, and you might have to fix that. Add power monitoring devices, and get the data into an energy monitoring or SCADA system.
“Use consultants and auditors for help,” says Feasel. “Compare and contrast, understand, and learn best practices. Encode what you learn into the company DNA – that’s how to get on the Dow Jones 100 Sustainability Index.”
Peterson adds, “Most industries, especially process industries, have an energy management, monitoring or conservation team, dedicated to saving money, but most are specific to electricity. You also can save so much money on gas, water and steam.
“Let’s make them efficient. Let’s start saving money big time.”


