Compressor power is not measured by amps alone
Too often, and most incorrectly, amperage alone is thought to be an accurate reflection of kilowatts (kW), which is then used to calculate an air compressor’s full-load specific power (scfm/kW) or to estimate flow (scfm). It’s equally incorrect to use this estimated kW to calculate the percent of full load in the capacity-control cycle.
Of course, kilowatts are a function of amperage (Eqn 1).
kW = (A x V x 1.732 x pf)/1,000 Eqn 1
where kW = input kilowatts
A = motor current (amperes)
V = line voltage
pf = power factor
But, you can calculate kW from measured amperage accurately only if you simultaneously measure the voltage and power factor. Or use a kW meter or motor analyzer, which gives a direct kW reading.
Table 1 is part of a compressed air audit intended to show the power savings, even at full load, of a variable-speed, rotary-screw lubricated compressor. The data are based on using current to compare specific power for a pair of 100-hp-class rotary screw compressors. Which option appears to be the most efficient?
It appears that the unit equipped with the VSD is the best choice. Table 2 shows a more rigorous estimation of specific power.
The truth is that the previous guess was wrong. That incorrect conclusion came about by believing that amps directly reflect kW, which, as you can see, isn’t the case.
Annual operating cost
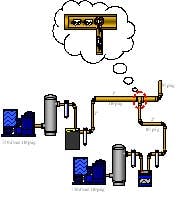
(Click to enlarge image) Figure 1. The turbulence-driven backpressure at the tee fitting causes one of the two units to short-cycle or back down. Both units can’t feed into the air system at full load due to the piping configuration and size.
A plant once found that its two 150-hp rotary-screw compressors couldn’t maintain the required minimum pressure (Figure 1). So, the service provider measured motor current to identify percent of load, which could indicate if additional air compressors are needed.
The service provider calculated the full-load current for each unit to be 194 amps at 460 V at 100 psig. Both units draw between 106 amps and 174 amps, which corresponds to between 55% and 90% of full-load amps (FLA). Therefore, the service provider concluded that when both units are at 90% of full load, they only have 20% reserve. The ensuing recommendation was to buy a third 150-hp unit to handle the perceived air demand.
What’s really going on
First, the service provider calculated the full load amperage at 480 V using this guideline: Amperage = 162 hp x 1.20 = 194 amps at 480 V. Then, the actual voltage was 430 V (10.4% low). Therefore, the calculation should have used a 10.4% higher amperage reading (194 x 1.104), or 214.2 amps. The actual data, measured with a motor analyzer, was 215 amps at 430V at 125 kW. Therefore, adding the voltage measurement gave a percent of FLA that ranges from 49% to 81% - not the 55% to 90%.
More importantly, the actual power (kW) measured a minimum of 92.3 kW (75%) and a maximum of 98.4 kW (80%). This would put the two units at 80% power, 35% to 40% flow for each (less than the total volume of one unit). A third unit is certainly needed. So, why can’t the plant hold pressure if there’s still 900 cfm of air left?
Piping correction needed
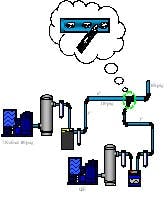
(Click to enlarge image) Figure 2. A directional tee and larger line size eliminated the problem shown in Figure 1.
The first fix was to increase the line size to 6 in. to reduce line velocity and replace the crossing tee with directional angle-entry fitting to eliminate the turbulent, high-velocity backpressure problem. It was the turbulence-driven backpressure at the crossing tee connection in combination with smaller piping that wouldn’t allow both units to run together at full load. The unit experiencing the highest backpressure backed down with the modulation control and sometimes short-cycled. Adding a third unit would mean installing another crossing tee and the increased flow would have increased the compressed air velocity, making a poor situation worse.
Figure 2 shows the change to the piping configuration that includes a directional angle-entry fitting and larger piping. After making this change, most of the time the plant runs on one unit. When the second unit comes on, it satisfies the extra demand, unloads and shuts off. Previously, when the second unit came online, it fought with the first unit at the crossing tee. Both units ran continuously at an unobserved part load. This was a very expensive misinterpretation.
Consider that the electrical energy operating cost to run two units with original piping was $91,536/year ((92.3 kW + 98.4 kW) x .06 kWh x 8,000 hours/year). The electrical energy operating cost to run one unit, with corrected piping, at or near full load is $59,040/year (123 kW x .06 kWh x 8,000 hours/year). The annual electrical energy cost savings is $32,496/year.
The operating cost expense of a third unit (estimated 90 kW) would have been $43,200/year (90 kW x 0.06 kWh x 8,000 hours/year and the avoided capital expense and installation of a new unit was $50,000. Cost to correct the connection and replace the original copper line with larger, coated aluminum pipe and reusable fittings was $15,500
When amps will do
It’s possible to use measured current to approximate the input power and flow on a positive-displacement compressor when it’s not practical or possible to measure kW directly.
Motor current measurements clearly delineate full-load from no-load (and blow down, if applicable) on a two-step control. This fact allows you to measure the proportion of the time the unit is loaded and, thereby, establish an average flow at the time. Estimated average kW might best be found by using the applicable standard CAC/DOE performance curves with the appropriate storage and blow down time as part of the calculation.
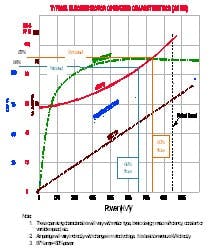
(Click to enlarge image) Figure 3. Use this graph to estimate power as a function of motor current.
Converting the measured motor current to estimated kW and using these standard CAC/DOE curves might be a little tricky if you want to correctly identify input power and convert it to estimated flow using modulation, variable-displacement, or variable-speed capacity controls. The relative speed on the VSD also is directly proportional to flow.
Remember some key facts regarding motor amperage. First, the amperage curve isn’t proportional to power from 100% load to no load. Second, current measured without voltage gives inaccurate results. Amperage varies inversely with voltage variance. If the 460 line voltage is 8% low (423 V), then the current will be 8% high. At 460 V, 110 hp would require 137 amps (hp x 1.25). At 430 V, it would require about 147 amps. This condition normally would be considered acceptable. The power company’s transmission system, nominally 480 V, is allowed to vary by 10%, within limits. The voltage is allowed to fluctuate from 420 V to 510 V and still be called a nominal 460 V.
To have a useful amperage reading, you’ll need to measure the voltage simultaneously. A good guideline to remember is that for a 460 V system, the full load amps (below 100 hp) is about 1.25 times horsepower. If greater than 100 hp, use 1.2 times horsepower.
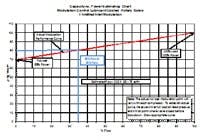
(Click to enlarge image) Figure 4. This modulation performance curve applies to a single-stage, 50-hp class, lubricant-cooled rotary screw compressor with modulation control.
Figure 3 shows typical motor performance curves and their relationships to each other. The specific curves vary by motor type, but the relationships that apply to a standard 1,800-rpm induction motor are similar.
In our example, the measured amperage is 87% of the measured full-load amperage which, in this case, reflects about 80% of full-load power (kW). The no-load amperage is 84% of full-load amperage, which reflects about 60% of full-load power (kW). This no-load percent of power is used to draw the “power-to-flow curve.”
Proceed as follows to construct the curve.
- Make simultaneous measurements of current and voltage at full-load and at no-load conditions.
- The no-load current (before blow down) of 102.6 represents 84% of full-load amps and, subsequently, 69% of full-load power.
- Draw a performance curve with the correct slope through the no-load point at 69%
- At 80% power, you have 35% flow (75 acfm out of 215 acfm).
This method is relatively accurate and sufficient for making a reasonable flow estimate. One caveat: Too many times the percent of full-load amps is used instead of percent of load. If the 87% of full-load amps had been incorrectly interpreted as 87% power, the estimated flow would have been almost 60% of full flow, or 129 cfm, a figure that’s almost twice the real value.
Hank van Ormer owns Air Power USA Inc., in Pickerington, Ohio. Contact him at [email protected] and (740) 862-4112.
