Pump systems are common to plants of all kinds, their reliable operation critical to production and their associated operating costs representing a significant part of plant operating costs. Pump systems account for about 25% of electrical energy consumption and more than 50% in pumping-intensive industries, according to the U.S. Department of Energy. Further, pump system optimization can reduce energy consumption of these systems by 20% in a typical plant.
In spite of their large operating cost, most pump systems are inefficient by design. Among the common design problems are non-optimal pipe sizing, control valve utilization and, perhaps most common, incorrectly sized pumps. Recently, a leading chemical company evaluating its internal practices found that it had been sizing 90% of its pumps incorrectly. While this may sound like a pump problem, focusing efficiency improvements solely on the pump is misguided. How a pump operates depends on the system, so improvements must focus on the system as a whole.
System modeling
Pump system computer modeling is the application of well-accepted principles of fluid mechanics to the calculation of flow through pump and piping systems, replicating the interdependency of the various system components in the digital domain. System modeling allows changing any aspect of system design or operation to see how the system as a whole will respond.
Focused on pumping systems’ energy savings, efficiency and economics, Pump Systems Matter (PSM) has made available the Pump System Improvement Modeling Tool (PSIM). PSIM is a free educational software tool focused on helping pump system engineers better understand the hydraulic behavior of pumping systems and how modeling tools can improve pump system efficiency (Figure 1).
Figure 1. The opening page for the free PSIM software.
Because it’s based on the leading commercial software package, AFT Fathom, PSIM’s capabilities include:
- System hydraulic calculation.
- Pump efficiency and BEP evaluation.
- Variable-speed pumps.
- Flow and pressure control valves.
- Impeller trimming.
- Automatic pump curve viscosity corrections.
- NPSH calculations.
- Pump vs. system curve generation.
- Pump energy use and energy cost.
PSIM users build pump system models in a familiar diagrammatic format within a user-friendly drag-and-drop interface. Pump, pipe and component data are then added through specification windows for each component. PSIM includes built-in databases of pipe materials and a range of fluids, or users can enter their own pipe and fluid data.
Modeling with PSIM
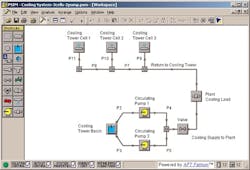
Consider a system consisting of a three-cell cooling tower, two circulating pumps and interconnecting piping. Figure 2 illustrates the simplified system model as it appears in PSIM’s workspace. Remember that while it provides useful, quantitative results, PSIM is an educational tool. Comprehensive, detailed system modeling will require one of the full-featured commercial modeling tools available.
Figure 2. Drag and drop the elements into place to generate the flow diagram.
PSIM models have only two types of objects, junctions and pipes. Junctions are system components such as the cooling tower basin, pumps, valves, cooling load, spray discharges and branch points, all of which are connected by pipes. Producing a model requires dragging the junctions from the toolbox onto the workspace and then connecting them by drawing pipes from junction to junction.
Double-clicking a pipe or junction opens a specification window that displays its data input fields. Pipes require a diameter, length and friction information (roughness, Hazen-Williams factor, etc.). These may either be selected from the built-in pipe database or the diameter and roughness information may be specified directly. Optionally, you can include loss factors for a variety of fittings and valves within the pipes by selecting from the several hundred items available from the included fittings and valves list.
While elevation data is common to all junctions, other junction data is as varied as the types of junctions available within PSIM. Reservoir junctions need a liquid level, while valves may either be selected from the included list or specified using a K factor, Cv or resistance curve. Pumps can be modeled as fixed flow, fixed head or pressure rise or by entering performance curve data for flow, head, efficiency and NPSHR. In addition to efficiency data for the pump itself, you can include efficiency data for the drive motor and variable-speed drive, as applicable.
In our example, a reservoir junction represents the cooling tower basin, pump junctions represent the pumps, a valve junction subs for a throttling valve used for flow control, a general component junction covers the central plant heat exchangers the system serves, and three spray discharge junctions represent the distribution piping and nozzles in the cooling tower’s three cells.
Pressing the buttons
The valve in our example demonstrates the flexibility that modeling offers in evaluating systems for which data may be limited. Consider the case in which the valve’s operating position is known, but resistance data is unavailable. You can determine the valve’s effective resistance using data available for the other components and the operating data for flow rate and pressure. Vary the valve’s K values, effectively changing the valve position, during iterative runs. When the available flow data and the calculated flow rate converge, you’ve found the operating valve resistance. This simple process works because modeling simulates not just the characteristics of individual components and piping, but also the interdependency of the system elements.
The paired pumps in our example are specified using manufacturer’s head, efficiency, NPSHR and motor efficiency data. Similarly, the spray discharge junctions are set to an elevation corresponding to the cooling tower inlets and specified with a resistance curve based on the tower manufacturer’s data for design flow and supply pressure.
Other variables specified in the example include an energy cost of $0.06/KW-hr and a one-year time period to evaluate annual energy cost. Any time period can be used and interest and inflation rates can be specified to calculate the net present value of the energy cost.
Reading the results
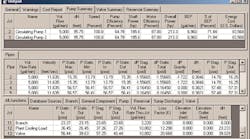
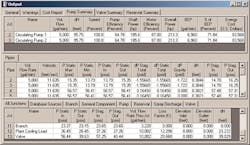
The text-based results are shown in PSIM’s output window (Figure 3). The output window is arranged in three sections; the general section at the top includes summary reports for pumps, valves and reservoirs and the cost report. The middle section is the pipe output and, at the bottom, is the junction output section.
Figure 3. The software performs many calculations that support system optimization.
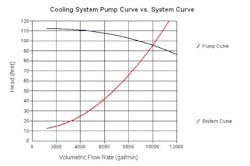
This example illustrates only a fraction of the fully configurable PSIM output data that can be presented in either English or SI units. In addition to text, PSIM includes two graphical outputs. The visual report displays selected input or output data with the model diagram. The graph results provide graphing capabilities for a range of system variables, such as the pump versus system curve (Figure 4).
Figure 4. The software can output system curves.
The pump summary report provides key information related to system efficiency. Overall power for each pump, that is, power into the motors as a function of pump and motor efficiency, is 213.3 HP each.
Energy consumption for one year is $83,569 for each of two pumps. While these pumps have a 76% peak efficiency (according to the manufacturer’s data), we can see they’re operating at only 65% efficiency. The reason is shown in the "% of BEP" column, which indicates the pumps are operating at only 72% of the best efficiency point (BEP) flow. These pumps are oversized. The valve at the pump discharge must be throttled to achieve the design flow rate. The last line in the output window says the valve throttling imposes a loss of 39 feet of head. System efficiency takes a hit from two directions - the pumps’ lower operating efficiency and the head loss across the throttling valve. Matching the pumps to the system requirements will address both of these issues.
Tweaking the numbers
Two potential modifications that would help match the pumps to the system are trimming the impellers and reducing pump speed. Both assessments can be made within PSIM’s modeling capabilities.
PSIM can handle an alternate operating line when only two cooling tower cells and one pump are operated during cold weather. Table 1 illustrates the PSIM results for the current and modified pumps for both cases.
The first case represents the initial situation, which suffers from reduced pump efficiency and throttling losses as discussed above. We next see the results of reducing pump capacity by trimming the pump impellers or reducing pump operating speed. Both alternatives eliminate the need for throttling because the pumps are now matched to the system requirements.
Impeller diameter and speed affect pump performance in a similar manner, so the amount of impeller diameter change required is the same as the speed adjustment needed. Note that when optimized, annual energy cost is reduced by $75,236, or 45%. Trimming impellers requires heavy lifting, while speed adjustment requires installing a variable-speed drive. Take your pick.
The following three cases illustrate how the system will operate under cold weather conditions. Throttling the original pumps will reduce the flow. Some throttling is also needed for the trimmed impellers because the trim was based on the original case. Still, there’s an annual energy cost reduction of almost 44% compared to the existing pumps. Variable-speed drives, however, without throttling, can reduce the annualized energy cost to 47% below the original case. Whether this savings justifies installing variable-speed drives will depend on the reduced flow mode duty cycle.
Finally, explore the effect of increasing the size of the main supply and return lines from 20 inches to 24 inches along with trimming the impellers. Reducing piping losses and matching the pumps to the system reduces annual energy cost by 53%, or about $14,000 more than just trimming the impellers. Whether this additional savings is justified by the cost of changing the piping is doubtful, but it illustrates the potential savings when building a new system, expanding an existing system or replacing corroded piping. The additional cost is only the incremental difference for the larger piping.
Try PSIM yourself
If this piqued your interest in learning about the benefits of system modeling, try PSIM yourself. The free software can be downloaded from Pump Systems Matter at www.pumpsystemsmatter.org. The PSIM software includes a comprehensive help system and several examples with step-by-step instructions available from the help menu.
Tom Glassen is vice president, operations of Applied Flow Technology, a charter sponsor of Pump Systems Matter and a member of the Hydraulic Institute. Contact him at [email protected] and (800) 589-4943.
Pump Systems Matter, developed by the Hydraulic Institute, is an educational initiative intended to assist North American pump users gain a more competitive business advantage through strategic, broad-based energy management and pump system performance optimization. PSM’s mission is to provide end users, engineering consultants and pump suppliers with tools and collaborative opportunities to integrate pump system performance optimization and efficient energy management practices into normal business operations.
PSM is seeking the active support and involvement of energy efficiency organizations, utilities, pump system users, consulting engineering firms, government agencies, and other associations. For more information on PSM or to become a sponsor, visit www.pumpsystemsmatter.org.
