How good is your warehouse, really? How can you tell?
Traditional measurements — order fill rates, cycle times, lines picked per labor-hour or cost per order shipped — can provide a good benchmark against a warehouse's own past performance, as long as the overall situation remains unchanged. In other words, these traditional measurements are fine as long as the world hasn't changed and products, customers, order profiles, technologies and costs have remained the same.But we live in a Heraclitean universe: Nobody walks through the same streamor the same warehousetwice. Furthermore, no two warehouses are exactly the same. Each has different space, equipment, employees, customers, order profiles, value-added services and cost structures.Looking outside
The good old traditional measurements are even less useful in making direct comparisons to other warehouses, even in the same company or same industry. The reason, as we all know, is "My warehouse is different!" No two warehouses have the same space, equipment or people or the same customers or the same order profiles, or the same value-adding services or the same cost structure. In fact, every warehouse really is unique. So how does one compare internal operational efficiency to the best warehouses?One approach is a conventional benchmarking study, in which partners share detailed technical analyses of operations looking for performance differences and, in particular, differences in technology, policy or practice. This approach can be effective, but it's also labor-intensive and expensive, especially if outside professional services are required.Use the Web
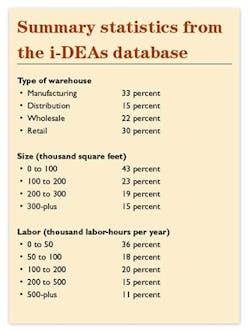
Georgia Tech has been developing an alternative to these individual, labor-intensive benchmarking studies. By exploiting Web-based information technology and a new approach to system performance assessment, any warehouse, anywhere, can benchmark itself quickly and inexpensively. The process provides both a ratingcompared to the best possible performanceand an indication of areas to investigate for improvement.The assessment methodology, data envelopment analysis (DEA), is based on a database of other warehouses. The version posted online is the Internet-based Data Envelopment Analysis system, or iDEAs. For every warehouse in the database, information is recorded about the resources used (space, equipment, labor, inventory) and the services produced (items and lines picked — broken case, full case, and pallet). The resource and service information is used in a system-based efficiency analysis. The identities of and data about participating companies, however, are treated as proprietary and not shared outside of the research team.Playing to winIn essence, the DEA analysis compares your warehouse to a "fantasy league" warehouse. You can compare warehouses two ways. In an output-oriented analysis, the fantasy warehouse uses the same resources as your warehouse, but produces the maximum possible output. In an input-oriented analysis, the fantasy warehouse has the same output as your real warehouse, but uses the least possible resources.For an input-oriented analysis, the efficiency score indicates how many resources, relative to you, the fantasy league warehouse used. For example, scoring only 80 percent means the fantasy league warehouse produced the same output as yours, but used only 80 percent of the space, equipment and labor. The closer a score is to 1.0, the closer you are to the fantasy league warehouse in terms of system efficiency. The score on the output-oriented version indicates how much output, relative to the fantasy warehouse, your warehouse produced. What's important is that this isn't an "average" performance comparison and isn't based on a single, partial productivity index. It's an assessment that considers every resource and service simultaneously. It determines from real warehouse data what the "best possible" performance should be.Early findings
So far, nearly 200 warehouses rely on this Internet-based tool. Comparisons among these early adopters confirm previous studies that indicate:
- Larger warehouses are not necessarily more efficient, at least with regard to equipment and labor.
- Labor-hours alone aren't a good predictor of system efficiency.
- While highly-capitalized warehouses tend not to be the most efficient, they are even less efficient if they also have a lot of space.
- No matter how the warehouse database gets segmented and sampled, a large fraction of the population is operating at a system efficiency of 50 percent or less.
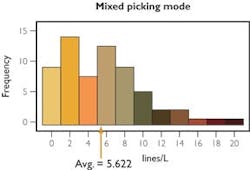
Figure 1. Typical distribution for lines picked per labor-hour. An analysis feature in iDEAs allows a comparison of your warehouse to the best warehouse in the database on a single partial productivity index, such as lines picked per labor-hour. This analysis of the performance difference on one partial productivity index can be used to estimate how much of the difference can be attributed to scale of operation, differences in technology and technical efficiency. The latter is the aspect of performance that's most directly controllable, at least in the short term. This analysis shows how much of the performance gap can't be controlled, at least in the short run, and how much represents plain old inefficiency.In addition to the resource and service data, the database also collects information on the nature of the warehouse requirements (number of stock keeping units, seasonality, variability), and particular technologies (bar coding, radio-frequency communication, warehouse management system), and practices (activity-based slotting, task interleaving) that might affect system efficiency. As the number of warehouses in the database grows, we'll be able to more accurately correlate system efficiency and particular requirements patterns, technologies and practices.Accessing the database requires a standard Web browser. Users receive a password after a straightforward registration process. The best way to proceed is to print a data requirements page and complete it off-line. Then it should take no more than an hour to key in the necessary data. The tool answers "what-if"questions:
- What if we reduced labor by 15 percent?
- What if the volume of case picks increased by 20 percent?
Leon F. McGinnis, Ph.D., P.E., is the Eugene Gwaltney Professor of Manufacturing Systems at the School of Industrial and Systems Engineering, Georgia Institute of Technology, Atlanta. He can be reached at [email protected]. iDEAs-W is a no-cost service of the Keck Virtual Factory Lab at Georgia Tech and can be accessed at http://factory.isye.gatech.edu/vfl/research/ideas.php. Figures: Georgia Institute of Technology
Sponsored Recommendations
Sponsored Recommendations
April 14, 2025
April 14, 2025
April 14, 2025


