2022 PdM survey results: How does your plant compare?
The last time Plant Services conducted its PdM Survey, in March 2020, very few people were treating predictive maintenance as a top of mind issue.
By the end of March, when the PdM survey period ended, the COVID-19 virus had destroyed $23 trillion in global market value, and various sectors of the world economy had come to a standstill. In the U.S. alone, 16.8 million workers had filed unemployment claims by April, putting the unemployment rate at 14.7%. People were searching less for “vibration analysis” and more for terms like “essential worker,” “remote monitoring,” and “contact tracing.”
What a difference 30 months can make. As I write this article, the national unemployment rate in the U.S. stands at 3.7%, with the manufacturing sector at 3.3% and having added 22,000 jobs in August. The ISM Manufacturing PMI was steady at 52.8 in August of 2022, the same as in July, with data indicating that new orders are expanding even as production is slowing. Also, the passage of the Chips and Science Act is poised to invest more than $52 billion in domestic semiconductor manufacturing. And 77% of people living in the United States have taken at least one dose of a coronavirus vaccine.
More than 100 maintenance and reliability practitioners responded to this year’s iteration of the PdM Survey, and the data indicate that the past 30 months have been a period of holding steady, combined with a steady increase in the willingness of plants to share their asset health data outside the plant. Read on to find out how your plant compares, and click here to download the full survery report.
1. Are you satisfied with your PdM program?
For eight years now, the baseline metric of the survey has been the measure of program satisfaction (see Figure 1), and this year a remarkable result has emerged.
For the first time since Plant Services started running this survey, the number of respondents who think their PdM program is not effective has dropped into the single digits, standing at just under 9%. This is a very welcome change from previous surveys, where this number stood above 15% in most years.
On the other hand, the number of respondents reporting they are satisfied with their program dipped back below the 50% mark, with only 48.7% of respondents considering their program satisfactory or better. In fact, program sentiment moved clearly into middle of the road territory this year, with almost 70% of respondents saying their program was either “satisfactory” or “needs some improvement.” Clearly it’s been a long 30 months, and respondents are not feeling as enthusiastic (or as negative) toward their programs as in early 2020.
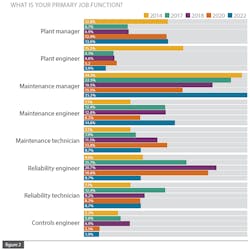
We use the question in Figure 2 to get a sense of how job titles wax and wane over the years, and this year’s interesting data point is the return of the maintenance manager role; after several years of steady decline, the number of maintenance managers responding this year jumped back to 2014 levels. Respondents with a maintenance engineer title also increased considerably, which mirrored a decline in the number of reliability engineers and maintenance technicians who responded. All other job titles held more or less steady since the last survey.
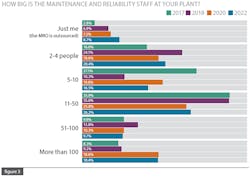
Another category that held remarkably steady is the size of maintenance and reliability team (see Figure 3). Given the wide variety of stresses on plant teams since early 2020, and the extent to which plants still report hiring and retention as their top challenge, these data are not surprising. It will be interesting to revisit these data on the next PdM survey, to see if teams grow with the expected increase in size of the U.S. manufacturing footprint.
2. What does your PdM program look like?
If Figure 1 is our traditional key KPI, then Figure 4 is the baseline index of what types of predictive maintenance technologies people report they are using. This year, the five technologies that have been at the top of our survey for the past several years remain the same (vibration, infrared, ultrasound, oil analysis, and electrical motor testing). As for the types of assets being managed by PdM solutions, rotational assets and electrical systems are the two front runners (see Figure 5), with only distribution pipelines and fleet vehicles lagging far behind.
It also is notable that the number of respondents who say they have no plans to deploy particular types of PdM technologies continues to drop slowly. Even during the stress of the pandemic, plant teams did not back away from predictive solutions.
3. Overcoming program obstacles
First, the good news: survey respondents are feeling the stress of PdM program obstacles far less in 2022 than they did in 2020 (see Figure 5). In nearly every key category on this question, fewer people reported feeling that a given obstacle was either high- or medium-level. For example, the top obstacle both then and now is “budget considerations;” however, where 87.5% said it was a high or medium stressor in 2020, only 66.2% did so this year.
The exception to this pattern is the “limited engineering resources” category, which was the only category that respondents told us is more of a stressor to them in 2022 (66.2%) than it was in 2020 (60.9%). The pain of limited budget may be an evergreen stressor, but these days plant teams are feeling the pinch of limited headcount just as much.
Data from the next survey question back up this finding (see Figure 7). When asked about the reasons why plant teams bring in outside contractors for PdM work, the top response was to gain access to the “specialized technical skills required for PdM,” followed closely by “skills gap” and “lack of skills and time among in-house staff.”
Finally, when it comes to PdM data sharing (see Figure 8), several interesting trends emerged. Quarterly data analysis is up across almost all types of teams, especially in-house teams. Also, monthly data analysis is up among in-house maintenance and reliability teams, and weekly analysis is up with third-party teams. Finally, PdM data are still being shared with operations teams, just not as frequently as 30 months ago, and 35.1% of respondents said that PdM data are never shared with operators.
4. What are you doing with your PdM data, and where are you storing it?
This article concludes with several charts that show the types of proactive (and reactive) maintenance that respondents are engaged with, as well as how they are collecting their data.
Figure 9 suggests that the willingness of plant teams to deploy both predictive and prescriptive maintenance technologies has stayed the same over the past 30 months, and that there’s increased eagerness to break away from run-to-fail maintenance modes. Figure 10 dives a little deeper into this area, as respondents were asked where they were on the CBM-PdM spectrum, with more than 63% of respondents indicating that they lean more toward condition-based maintenance than PdM.
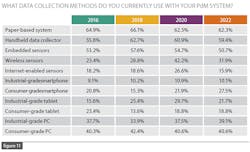
Getting toward the end of the survey, we always ask about data collection methods, and wonder if or when digital methods will overtake analog paper-based systems at some point. Yet again, this year showed we’re not quite there yet, with 62.3% of respondents keeping paper-based systems in the top spot (see Figure 11). The only method that showed an increase since 2020 is the use of consumer-grade smartphones, with a modest rise to 27.5%. The only surprise on this question was that both wireless and internet-enabled sensors showed a drop in use among respondents over the past 30 months.
Another surprise emerged when we asked respondents about whether their PdM systems were integrated with any higher-level systems. The data showed a drop in integration across nearly every category, and especially for data historians (reported drop in use of 44%) and EAM/CMMS systems (reported drop in use of 34%).
However, respondents were optimistic that investments in these areas would re-emerge within three years. And, in the area of cloud-based analytics, reported use increased by 45%. It may have been a stressful 30 months, but faith in the value of PdM programs has persisted.
About the Author

Thomas Wilk
editor in chief
Thomas Wilk joined Plant Services as editor in chief in 2014. Previously, Wilk was content strategist / mobile media manager at Panduit. Prior to Panduit, Tom was lead editor for Battelle Memorial Institute's Environmental Restoration team, and taught business and technical writing at Ohio State University for eight years. Tom holds a BA from the University of Illinois and an MA from Ohio State University


