A practical framework for maintenance prioritization in industrial operations
Key Highlights
- Prioritize maintenance requests by scoring impact and resource needs to ensure high-value work is addressed first.
- Use a small set of KPIs linked to real business losses, such as constraint downtime and safety exposures, to guide decision-making.
- Categorize work into four buckets—Quick Wins, Constraint Focus, Deferred Work, and Efficiency Projects—to streamline scheduling and execution.
- Implement a weekly review cycle to verify that completed work has effectively reduced targeted losses and adjust signals or definitions as needed.
- Maintain discipline by clearly defining constraints, keeping signals practical, and fostering a culture of continuous improvement for sustained results.

When maintenance priorities are unclear, the loudest alarm wins—and backlogs grow. This method scores maintenance work by business impact and resource intensity, helping teams decide what comes first, what can wait, and whether the work they finished actually reduced the loss it was meant to fix. A 30-day pilot puts it in place.
Maintenance teams are rarely short on effort. They are short on clarity. When every shift has a different definition of “critical,” the schedule gets driven by the loudest alarm, not the highest-value job. Urgent requests multiply, planners feel trapped, and the backlog becomes a parking lot for work that never gets cleanly defined.
Quick test: if next week’s capacity dropped by 40%, which work orders would still protect throughput, safety, and customer risk—and which could safely wait? If that is hard to answer, your prioritization system needs a business anchor.
The fix is not a bigger dashboard. It is a short loop, repeated every week: anchor priorities to real business loss, score every request the same way, schedule the work through a few clear buckets, and verify that what you finished actually moved a number.
Backlogs can grow even when teams work hard, so anchor priorities to business loss
You do not need ten KPIs. You need a few that everyone agrees represent business pain. Start with a small set of KPIs that represent real loss in your plant. Keep it practical. The goal is to pick the right work first—and then prove it reduced losses that matter.
A few loss measures anchor most decisions:
- constraint (limiting asset or cell) downtime minutes rather than total downtime;
- schedule risk such as missed orders, overtime escalation, and late changeovers;
- safety and compliance exposure, including near misses, protective-device trips, lockout/tagout gaps, and OSHA or NFPA 70E findings;
- scrap and rework, including quality escapes;
- abnormal energy per good unit, which is both a cost and a sustainability signal. (Note: Many brownfield plants cannot see energy per good unit without sub-metering, so treat it as a measure to work toward, not a day-one requirement.)
Constraint downtime sits first for a reason, but it assumes you know your constraint. Find it where work consistently piles up, or where a stop turns into missed orders fastest, or through a simple criticality ranking. That ranking can borrow the discipline encouraged by reliability-data practice and reliability-centered maintenance: define the asset, understand what its failure costs, and connect the work to throughput, safety, quality, or cost.
In many plants, one asset can set the pace for everything downstream—the constraint at the heart of the Theory of Constraints—and finding it should rest on evidence. Not every plant has a single bottleneck; parallel lines and job shops may have several, or one that moves with the product mix. When that happens, rank the few assets whose downtime hurts most and treat that short list as your constraint set, refreshed as the product mix shifts.
Score every request on impact and intensity
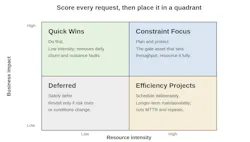
Prioritization becomes repeatable when every request is scored on two factors: its business impact—what happens if this failure repeats—and its resource intensity, meaning what it will realistically take to fix in labor, spares, and outage window (see Figure 1). The useful part is not the matrix itself; weighing impact against what a fix will cost is a familiar idea. The value is forcing every request to show both the loss it prevents and the resources it will consume.
Most teams have deferred a “small” fix and then lost a shift to the breakdown it became; scoring both factors in the same frame is what prevents that outcome. Except for immediate safety, environmental, or regulatory threats, which act first and get scored afterward, the rule is simple: if a request cannot be placed on the matrix, it is not defined well enough to schedule.
Resource intensity is what you already know from the plant: the labor hours and skill type required, parts lead time, access constraints and permits, and the outage window and coordination needed across operations, safety, and contractors. Scoring it honestly keeps “simple” work from being mislabeled and quietly postponed.
Score the impact in plain language and tie it to one of the loss measures above—how many constraint minutes it protects, what exposure it removes, what scrap it prevents. If the requester cannot put that in a sentence or two with basic evidence, the work is not ready to schedule yet.
Once a request is placed, the quadrant tells you what to do next:
- Quick Wins (high impact, low intensity) remove nuisance trips, sensor drift, small leaks, and the repeatable minor faults that create churn.
- Constraint Focus (high impact, high intensity) protects the gate asset or limiting cell that controls throughput; these jobs deserve planning, a spares strategy, and outage coordination.
- Deferred Work (low impact, low intensity) can be parked and revisited only if risk increases, but deferred, not forgotten.
- Efficiency Projects (lower urgency today, high intensity) are maintainability upgrades whose payoff is mostly downstream—lower mean time to repair (MTTR) and fewer repeat failures—so schedule them deliberately rather than letting them crowd out stability work.
From triage to a weekly schedule: the four buckets
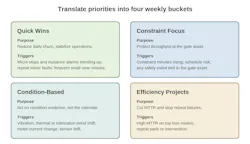
Together, the matrix and the buckets are the core of the method, but they are two different lenses, not the same four boxes seen twice. The matrix sets priority—how much a request matters and how hard it is—and sorts it into a quadrant. The buckets set execution—how the work is triggered and run each week (see Figure 2).
Three names overlap because the work types line up; two differ on purpose. Deferred work gets no weekly bucket, because you parked it. And a Condition-Based bucket appears for work that a live signal triggers rather than a one-time score.
The routing is straightforward. Quick Wins and Constraint Focus carry over from the matrix directly: stabilize daily churn and protect the gate asset. Maintainability work—anything aimed at lower MTTR or fewer repeats—usually runs through Efficiency Projects. The constraint is the exception: any work that touches the gate asset, including maintainability upgrades, stays in Constraint Focus so it takes the scarce outage window first and is never routed behind a lower-value job.
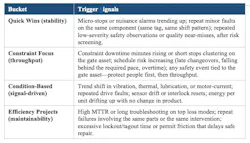
A live condition signal can trigger work from anywhere on the matrix. The work still needs an impact and intensity check so planners know whether it should interrupt the schedule, wait for the next outage, or simply be monitored. Done well, condition triggers also let you retire or retarget calendar tasks the data shows are unnecessary; reinvest the freed technician hours in the Quick Wins that keep churn down. Keep the signals small and practical; a few high-quality ones beat a noisy dashboard. Table 1 shows which trigger signals should pull work into each bucket.
Verify that the work moved a number
Scoring and scheduling mean little if you never check the result. For each completed item, look at the loss measure it was meant to affect, before and after, over a window long enough to matter—at least as long as the failure’s normal return time, so a problem that used to recur monthly is judged over months, not days.
Be honest about attribution. In a running plant many things change at once, so a measure that moves a KPI—or fails to—cannot always be pinned on one job. Treat the check as directional evidence, not proof: compare against a stable baseline. Watch whether the specific failure you targeted actually stopped recurring. Be skeptical of a “win” that happens to coincide with a lighter production week or a change in what you are making.
When the measure does not improve, resist the urge to blame the framework. Usually the signal was wrong, the work was defined too loosely, the execution was incomplete, or the effect is real but masked by other changes. Isolate what you can, fix that, and run it again. Over a few cycles, this is what shrinks the backlog: low-value maintenance work stops coming back, and the work that stays has earned its place.
The same logic across continuous, discrete, and batch operations
You can use the same method regardless of process type. The work looks different, but the decision logic stays the same. How large the gains turn out to be depends on your baseline and your execution discipline; what stays constant is the direction of improvement and the way each example is classified.
In a continuous operation, a sensor that keeps shutting the line down because it sits where dust or spray fouls it is a classic Quick Win. Moving or shielding the sensor and adding a quick daily check can often reduce the repeated stops. The production line runs closer to its normal rate—the performance gap that OEE tracks—and the team gets back the runtime that used to vanish in short, uncounted interruptions no one was logging.
In a discrete line, the one machine every unit must pass through—a bottleneck nobody can route around—is a Constraint Focus priority. This work is often about maintainability: stocking its key spare parts, writing down a standard way to change them out, and rehearsing that change before it is needed—the same kind of work that would be an Efficiency Project on an ordinary asset. Because it touches the constraint, it stays in Constraint Focus and takes the outage window first. Again, the two lenses combine: the matrix says the asset matters, the bucket says how to act. The payoff comes less from any single fix than from removing the scramble when it does fail: no hunting for parts, no debating who does what, no searching for the procedure while the line sits idle.
In a batch or mixed operation, a valve that is slowly sticking—or a utility like steam or compressed air that sags when demand spikes—can make each cycle run a little longer than planned, and those extra minutes pile up into missed schedules. Watching a simple signal, such as how long a step takes or a pressure that should hold steady, catches the drift while it is still small. That moves the work off a fixed schedule and onto Condition-Based action: you fix it when the signal says so, not on a date that may be too early or too late.
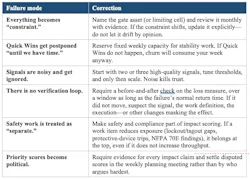
Where this method tends to break, and how to keep it honest
This method is not perfect but fails in predictable ways. The corrections listed in Table 2 keep the system credible and the plan protected.
Where IIoT, edge analytics, and condition data fit
Condition data helps when it changes the work request, not just the dashboard. A vibration trend, repeated drive fault, thermal hot spot, or drifting sensor should arrive at the computerized maintenance management system (CMMS) with enough context—asset, timestamp, trend, comparable history—for a planner to decide what happens next.
Edge analytics is most useful when it is scoped to a few high-value failure modes rather than asked to predict everything. The practical payoff is faster routing. Planners spend less time debating the alarm and more time deciding the right maintenance action.
A more practical next step is to attach clear work instructions, lockout points, photos, and inspection checks to the work order, so the technician does not have to reconstruct the problem from a vague alarm note. This matters most for less experienced technicians and cross-shift handoffs.
This only works if your asset hierarchy, tag naming, and event definitions are stable; otherwise you automate noise. Use basic management-of-change (MOC) discipline as you add signals, so an instrumentation change does not introduce data gaps or network blind spots.
A practical 30-day pilot
If you already have a planning meeting cadence, keep it—but change the inputs. Use the matrix for clarity, the buckets for scheduling, and the KPI check for verification.
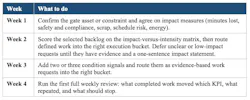
In many plants, a focused 25-minute weekly review is enough to start keeping the system honest. Cover constraint losses from the past week and the top protective action; Quick Wins completed and whether nuisance events actually dropped; which condition alerts were real versus false, and what threshold tuning that implies; MTTR and repeat-failure progress with next actions; and owners, due dates, and deferrals—each deferral recorded with a reason.
What separates the plants that make this stick
The plants that get the most out of this method are rarely the ones with the most sensors or the smartest algorithms. They are the ones that have named their constraint honestly, kept a failure history their technicians actually trust, reserved real capacity for stability work, and built the habit of checking whether the KPI moved. The matrix and the buckets work because that discipline sits underneath them; without it, they become another scoring exercise that the loudest alarm still overrides.
When the method is sustained, the payoff can show up beyond reliability: fewer emergency call-ins and less overtime, lower scrap and energy waste, fewer repeat failures that chew up spares, and a better safety and compliance posture.
Pick the loss that is hurting you most right now—nuisance stops, repeat failures, slow repairs, or a gate asset that keeps breaking—and run the method against it for one month. If the loss does not move, adjust the signal, the work definition, or the execution, and run it again. The plants that stay with that loop are the ones whose backlog finally starts to shrink.
About the Author
Varma Raju Sagi Venkatapathi
Sagi Venkatapathi is a sheet manufacturing controls and automation consultant and technology specialist at Honeywell with more than 23 years of experience across continuous sheet manufacturing industries, including paper, extrusion films, metals rolling, lithium-ion battery, and tire-related web processes. He has led Machine Direction/Cross Direction (MD/CD) measurement and advanced control system implementations across 250+ sheet manufacturing facilities in 16 countries, focusing on operational performance, quality, stability and KPI-driven improvement. He is a Senior Member of IEEE and ISA and a Fellow Member of IETE. Contact him via LinkedIn.