6 KPIs to drive reliability and maintainability best practices
The University of Tennessee's Reliability and Maintainability Center (RMC) has started its “Six Metric Areas to Best Practices” initiative. The premise of this effort is three-fold:
1. Although many companies have upward of 100 key performance indicators (KPIs), only a small number can be significantly improved upon with a stated initiative. Work on what matters – the vital few. Make sure that they properly align up and down the organization. Ground-floor tasks should be clear, actionable items supporting higher level goals. Internal competition for limited resources weakens all initiatives. This applies to any kind of industry (discrete manufacturing, process, medical, distribution, energy, facilities management, etc.).
2. Data should be more industry-specific when looking at KPIs. Average data is a good start, but it only points you in the general direction. For example, if I stand on hot coals and put my head in a bucket of ice water, my body temperature may still be about average. But, how meaningful is that to me if I'm told my temperature is normal? Let’s use “maintenance cost/replacement asset value” as an example. The average for North American business is about 7 to 8 percent. However, if you are a pharmaceutical company, your best-to-worst plant may range from 1.5 to 6 percent. If you are a mining company, your best site may be 7 percent and worst site may be over 20 percent. So, KPIs studied should be industry specific.
3. Benchmarking data, by industry type, should be readily available to help focus ongoing improvements. The effort to compile data is in progress. Results will be published to help benchmark competitive gaps and guide continuous improvement in reliability and maintainability (R&M) initiatives. Specific companies and industry types will be targeted to compile needed data in order to enable comparisons by industry type. Participating companies providing data will get a summary of the results and opportunities for additional learning.
When looking at the multitude of KPIs from any company, they all support the areas of safety, people, quality, responsiveness (delivery), and cost. So, it’s important that the KPI areas selected can make a positive difference on each of these areas. The six identified key performance indicator areas selected will enable that result; for example, a reduction in reactive maintenance is also a great leading indicator for improving safety.
The six metric areas that will initially be focused on are:
- Percent Reactive Maintenance. Data on predictive, preventive, and capital projects also will be collected when available.
- Maintenance Cost/Replacement Asset Value, expressed as a percent.
- Overall Equipment Effectiveness (OEE). It encompasses availability, performance, and quality, and when used correctly is removing waste. I prefer total effective equipment performance (TEEP) which is based on 365 days x 24 hours availability, so the focus can truly be on continuous improvement.
- Inventory Turns. This is key for both the overall product and MRO spare parts.
- Mean Time Between Failure (MTBF).
- Suggestions/Employee.

Our data suggests that improving these metrics will drive positive results in all parts of your business. It’s important to note that the effort should be to instill best practices to attain the KPI improvement. You can get to a best practice value by cutting costs; however without the R&M process maturity to support it, you are headed for failure.
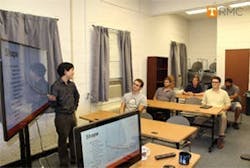
The University of Tennessee has over one hundred labs within the College of Engineering, including several for data analysis. This benchmarking initiative is being coordinated through the RMC Data Analysis Lab. Here undergraduates are being taught practical Weibull Analysis skills and reliability modeling techniques in preparation for future internships and careers. There are 145 students currently taking the Reliability class required for the Reliability and Maintainability Engineering (RME) minor. The RMC training is in addition to their schooling and is done on a voluntary basis. The RMC Data Analysis Lab will also take on company-specific projects.
About the Author
Klaus Blache
UT-RMC
Dr. Klaus Blache is research professor, industrial and systems engineering, and director of the Reliability and Maintainability Center, University of Tennessee College of Engineering in Knoxville. He was chairman of the Society of Maintenance & Reliability Professionals from 1997 to 1999, when he was manager of manufacturing reliability and maintenance at General Motors. He can be contacted at [email protected].