How vibration analysis and digital twin models help prevent downtime and grain dust explosions
Key Highlights
- In 2025, seven grain dust explosions were reported in the U.S.
- Deploying a predictive digital twin dashboard starts with defining your facility's operational priorities.
- A timeout rule can prevent operator alarm fatigue.
- Introducing a digital twin dashboard may require some cultural adjustment, but doing so can switch conversations from finger-pointing to collaborative problem-solving.
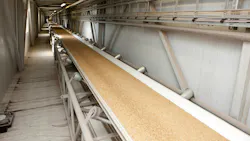
I can clearly recall the exact moment our team realized that our traditional view of facility performance was dangerously flawed. We were sitting in the control room of a major Mountain West milling facility, conducting a post-mortem analysis on a recent railcar load-out. On paper, the facility appeared to be performing flawlessly. Our legacy supervisory control and data acquisition (SCADA) system showed the primary bucket elevator and shipping belts humming along with a 92% availability rate.
Yet, it just took us 12 hours to load a unit train that, based on our theoretical load-out capacity, should have taken eight.
Where did those four hours go? The manual logbooks and whiteboards that we used to coordinate truck unloads and bin routing offered no answers. Because the conveyor motors were energized and drawing power, the SCADA system recorded the equipment as “operational.” It was an illusion of efficiency. We were burning electricity, wearing down mechanical bearings and generating massive amounts of suspended dust, but we weren’t moving sellable products. That was the moment we realized that without a throughput-based, digital measurement system, we were flying blind not just financially, but from a safety perspective as well.
The agricultural commodity supply chain demands high-volume throughput, but that volume continuously generates a lethal by-product: highly combustible grain dust. High-volume handling generates massive particulate loads; empirical studies reveal that handling wheat generates 64.6 grams of total airborne dust per metric ton handled, while shelled corn generates an astonishing 185.1 grams per metric ton. At these mass flow generation rates, manual sweeping cannot mathematically keep pace. The realization that our belts were running empty also meant we were generating suspended dust and friction for absolutely no reason.
Grain dust explosion risks demand proactive monitoring
To understand the gravity of this hazard, one only needs to look at the 2025 annual report on agricultural confined space and dust explosion incidents from Purdue University's Agricultural Safety and Health Program.
|
2025 U.S. Grain Dust Explosion Statistics |
Metric / Detail |
|
Total Reported Explosions |
|
|
Fatalities |
4 (Increase from 0 in 2024) |
|
Injuries |
10 (Increase from 2 in 2024) |
|
Primary Fuel Sources |
|
|
Identified Ignition Sources |
Smoldering grain, overheated bearing, equipment maintenance, dust fire |
While the frequency of incidents was slightly below the 10-year average, the severity escalated dramatically. The recurring ignition sources, specifically overheated bearings and smoldering grain, highlight a critical vulnerability. A worker physically walking the floor to detect an overheated bearing or visually estimating dust accumulation against the OSHA 1/8-inch rule is inherently reactive. By the time a human operator detects the warning signs, the system is already critical.
Defining the constraint: Why the bucket elevator?
When our cross-functional team comprising maintenance, engineering, automation and IT set out to build a predictive digital twin dashboard, our first major hurdle was determining what to measure. We needed a primary constraint measurement point.
Through collaboration between operations and engineering, we determined that the main leg of the bucket elevator had to serve as our operational heartbeat. The reasoning was twofold. First, from a throughput perspective, every horizontal drag conveyor and pit auger eventually routes to the vertical leg. If the bucket elevator slows down, the entire upstream process must halt to prevent catastrophic chokes.
Second, the bucket elevator is the most volatile asset regarding combustible dust ignition. The enclosed casing acts as a perfect confinement chamber, and the bearings are subject to immense radial loads. Bearing failure accounts for 40% to 50% of all rotating machinery breakdowns, remaining a primary ignition source for explosions.
By outfitting these bearings with high-frequency Industrial Internet of Things (IIoT) vibration sensors, our digital twin utilizes machine learning to analyze ultrasonic stress wave emissions and excess kurtosis. Instead of waiting for a legacy temperature probe to trip after the metallurgy has failed, the system detects Stage 1 subsurface fatigue micro-cracks 60 to 90 days before catastrophic failure occurs.
Developing the five-minute no-flow rule to detect downtime
Activating thousands of continuous sensors comes with a massive operational risk: operator alarm fatigue. If the control room is inundated with false positives, operators will eventually ignore the system.
We had to tune our throughput-based overall equipment effectiveness (OEE) model to separate normal operational variances from systemic bottlenecks. In a bulk material facility, brief interruptions like purging a belt or waiting for a truck to align over a dump pit are standard.
By analyzing the motor amperage drawn on the bucket elevator over several weeks, we empirically determined that routine operational transitions rarely exceeded four minutes. Thus, the “five-minute no-flow timeout rule” was born. If the bucket elevator runs without a load (indicated by a drop to baseline unloaded amperage) for exactly five minutes, the system automatically logs a “No-Flow Downtime” event. This rule acted as our diagnostic filter, forcing the control system to ask: Why is the central artery running empty?
Uncovering the hidden bottleneck: A case analysis of truck scheduling
What the new system revealed about our facility performance was staggering. When we deployed the digital twin dashboard and applied the five-minute rule, we uncovered a massive hidden bottleneck.
The data showed that while the bucket elevator was running continuously, it was experiencing dozens of micro-stops that floor operators simply weren't documenting. We traced the root cause backward from the elevator, out into the truck receiving yard.
The culprit was an IT/OT scheduling conflict. Our yard management system (YMS) was processing inbound grain trucks in strict chronological order. Whenever a truck carrying a different grade of commodity arrived, operators had to physically clear the receiving pit, wait for the conveyors to empty and re-align the routing gates. Each commodity changeover caused a three-to-six-minute gap in grain flow. Because this occurred up to 20 times a shift, we were unknowingly losing over two hours of productive elevating capacity every single day. The belts were conveying empty air, generating combustible dust for no financial return.
The action we took was immediate. We upgraded the YMS to utilize AI-assisted capacity scheduling, actively grouping vehicles carrying identical commodities into specific staging lanes. On the hardware side, our automation team implemented closed-loop control on the bin routing gates, utilizing radar sensors and automatic pause-and-resume features to perfectly time gate openings and eliminate flow gaps.
Using digital twins to map dust hazards and improve efficiency
Simultaneously, we tackled the fuel source. Our digital twin incorporated continuous optical particulate sensors and LiDAR nodes to generate real-time 3D spatial maps of dust accumulation.
This data feeds into computational fluid dynamics (CFD) models. Because dense grain dust clouds frequently agglomerate, clumping together and altering aerodynamic drag in ways traditional models fail to predict, the CFD models are continuously calibrated against empirical sensor data. We finally had a dynamic heat map that mathematically eliminated the “dead zones” where dust quietly built up to the Lower Explosive Limit (LEL).
The operational results followed immediately. The no-flow downtime logged by the bucket elevator plummeted from more than two hours per shift to a mere 0.3 hours. Our OEE surged from a sub-optimal 51.6% to 84.9%. By automating safety interventions, such as triggering localized baghouse suction when dust levels rise, we reduced the need for manual labor in hazardous Division 1 zones from 80-100 workers down to 20-30 workers.
Furthermore, this verifiable, data-driven assurance of hazard mitigation positions facilities favorably in an increasingly strict insurance market, where underwriters like FM Global offer significant premium credits for proactive resilience investments.
Using operational data to transform a shared safety culture
How did operators initially react to the new measurement system? With healthy skepticism. Many feared it was a micromanagement tool designed to track their every move.
But as the data flowed in, a profound cultural transformation occurred. Historically, when a load-out target was missed, management blamed operations, operations blamed maintenance, and maintenance blamed operations. The dashboard changed those conversations entirely.
When the digital twin proved mathematically that the bucket elevator suffered 42 minutes of downtime due to an upstream supply chain failure in the YMS, the conversation shifted from finger-pointing to collaborative problem-solving. It validated the operators' lived experience on the floor.
The grain handling industry has long accepted reactive safety as a necessary constraint of massive scale. Digital twin frameworks challenge that assumption. By auditing your current IIoT infrastructure, bridging the IT/OT divide and listening to the data, you can shift your facility from reactive compliance to predictive control.
About the Author
Akhilesh Korpe
Akhilesh Korpe is an operations supervisor at Ardent Mills, LLC, and an independent researcher focused on bulk material handling optimization and continuous flow processes. Connect with him on LinkedIn at www.linkedin.com/in/akhilesh-korpe.