How maintenance leading indicators improve OEE, cost per unit, and EBITDA
Key Highlights
- Lagging indicators measure past performance and are too late for corrective action, while leading indicators predict future outcomes and enable proactive improvements.
- Improving OEE through targeted actions like reducing setup times and breakdowns can significantly increase profit margins and production efficiency.
- Focusing on daily activities and process improvements allows maintenance to be viewed as a profit center rather than just a cost center.
- Understanding the relationship between leading and lagging indicators empowers teams to make data-driven decisions that enhance plant performance and profitability.

Scenario: Sales forecasts are down over last year, but people want the budgets to stay the same. If that happens, that means we will lose margin on the products we sell. The only solution? Cut head counts and cut budgets. Why? Because that is the only way to lower plant level costs.
But what if there was another way?
Why lagging indicators only measure past performance
A lagging metric can track the success of your goals, but it can only measure what has already taken place. Lags are measures you spend time losing sleep over because by the time you see them, it is already too late to try to make a correction. They are things like revenue, profit, quality, and customer satisfaction. By the time you see them, the performance that drove them has already passed. You can’t do anything to fix them; they are history.
How leading indicators predict manufacturing performance
A leading measure is a predictor that drives the lagging indicator. Lead tracks the critical activities that drive or lead to the lag measure. They are influenced directly by the team. Once a team is clear about its lead measures, their view of the goal changes.
For example, OEE is the leading indicator for EBIT(DA). By the time it is measured, the ability to change it is in the past.
This begs the question: isn’t OEE a lagging indicator as well? Well, yes. It is both leading and lagging. It is lagging at the plant level, but a leading indicator to what your EBIT(DA) is going to look like.
So how can we change or influence OEE? This is where some of the true leading indicators come in. Let me walk you through a progression on how it starts versus how we should be operating and measuring performance.
How OEE influences cost per unit and EBITA
In order to see the real effect on EBIT(DA), we really need to add a few steps. We need to break out the loss hours and the costs per unit. In doing so, we can get a lot closer to seeing the true affect OEE has on EBIT(DA).
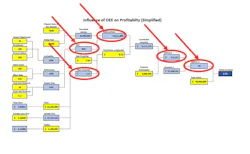
So, we can go from $2.31 per unit to $2.19 per unit and raise EBIT(DA) by 6%, resulting in a profit difference of a bit over $3MM with 2MM more units produced.
Now for the ultimate question? Can you sell the units? Typically, and for years, sales and marketing has talked a big game about how they can sell anything that you can throw their way, but when the rubber meets the road, it will be found out that you were just the scapegoat for their inability to drive sales or if they truly meant business.
This is the power you have in the maintenance group. You can begin recreating the image of maintenance, not only as the scapegoat, but as a true profit center.
The next question becomes: If OEE is both a leading and lagging indicator, what are the actions or predictors that drive change to OEE?
There are many leading indicators that we can use to predict whether the OEE will improve or not. Given the information provided earlier, we know how to find our losses with a given system. So, let’s look at a few loss buckets and try to understand what some of the leading indicators could be to predict an overall improvement to my OEE, which, in turn, improves my EBIT(DA).
Leading indicators that drive OEE improvement
Setup and adjustment. With setup and adjustment time, we know it is deviation from a set standard. If we measured the number of changeovers completed to standard or the percentage of back on time from breaks, and we keep this at zero, we would have no setup and adjustment downtime.
Breakdown, process failures, and minor stops. With these three buckets of loss, there are contributions by many departments that contribute to the elimination of these losses. From a maintenance perspective, the number of defects solutioned and the percentage of correct work from PM, PdM, or clean, inspect, lubricate (CIL) would help contribute to the elimination of these losses.
From operations, CIL completion percentage and the percentage of corrective work from CIL and the percentage of operators trained and qualified on the equipment would be a good place to start. With your CI or OPEX group, the percentage of equipment centerlined and the percentage of equipment running within centerline would contribute of eliminating many of these issues.
Examples of financial leading indicators
- number of changeovers ended on time
- number of defect solutioned from PM/PdM/CIL
- CIL completion percentage
- percentage of operators/maintenance trained on equipment
- percent of equipment center-lined
- number of problems solved
- startup/shutdown checklist completion percentage
Examples of cultural leading indicators
- number of 5S behaviors encouraged
- RED means opportunity encouraged
- root cause elimination encouraged
- more time for precision maintenance encouraged
Examples of plant-level lagging indicators
- overall equipment effectiveness
- total cost per unit
- high morale
- zero safety incidents
- zero customer complaints
- 100% on time delivery
Maintenance has an opportunity to influence much more than equipment uptime. By understanding the relationship between leading and lagging indicators, and by focusing on the daily activities that improve OEE maintenance can directly influence cost per unit, and ultimately EBIT(DA). Rather than simply measuring results after they happen, the goal is to focus on actions that drive those results and continue changing the perception of maintenance from a cost center to a true profit center.
About the Author
Joe Anderson
Joe Anderson is a partner and chief operating officer for ReliabilityX. Joe helps companies reach their full potential through improvement gains and lowering costs, giving them a competitive advantage on their journey to excellence. As an active columnist in Plant Services magazine, Joe shares his over 25 years of experience in maintenance, reliability and management excellence in various industries with the world through his writing. He is a CMRP, CRL, CARO, MLT2, MLA1, LSSGB, IAM-55k, CRL Black Belt and was recognized as one of the top 50 leaders in the country by the United States Congress, being awarded the National Leadership Award. He has also brought humor to the world through his experiences, and it can be seen in the character creation of Captain Unreliability.