Rethinking OEE for grain handling: a throughput-based model that exposes hidden downtime
Key Highlights
- Traditional OEE models are ill-suited for continuous bulk flow environments like grain elevators.
- A customized throughput-based OEE model provides real-time insights into equipment performance and bottlenecks.
- Automated timeouts and micro-stoppage detection eliminate manual reporting biases
- Capping OEE at 100% enforces safety limits, preventing dangerous overspeeding and reducing the risk of catastrophic dust explosions.
Grain-handling facilities might have all the right data but are measuring the wrong parameters. The agricultural supply chain operates under intense pressure, relying on commercial grain elevators as critical circulatory nodes for massive volumes of bulk commodities. During peak harvest and heavy export seasons, these continuous-flow facilities are pushed to their absolute limits.
Yet, despite the massive scale and financial stakes of these operations, facility managers frequently struggle to answer a fundamental question with real-time, empirical data: How effectively is our equipment running right now?
Industry blind spot: Misapplied OEE
In traditional discrete manufacturing, such as the assembly of automotive components or packaged consumer goods, the industry relies heavily on overall equipment effectiveness (OEE). In these environments, production is measured in distinct, countable units, utilizing a rigid formula:
OEE = AVAILABILITY X PERFORMANCE X QUALITY
This model tracks “good parts per minute” against an engineered “Ideal Cycle Time” that targets a benchmark. Attempting to force-fit this rigid, discrete formula onto a high-volume commercial grain elevator creates problems with distortion. Grain elevators handle continuous streams of bulk materials, strictly governed by gravitational, volumetric, and aerodynamic forces. Because agricultural commodities do not move in discrete, countable widgets, there is no determinable Ideal Cycle Time for a single kernel of grain. Throughput is strictly governed by localized mechanical capacity limitations.
Before” state: Guesswork in the dark
Before implementing a customized technological solution at Ardent Mills, we were operating much like the rest of the industry. We faced a classic “black box” scenario. While company departments like Pack and Mill had highly standardized metrics, the Elevator department lacked a standardized OEE system because bulk flow is so variable.
We judged daily operational performance by looking at a lagging indicator: total bushels moved at the end of the shift. If we missed our targets, it was incredibly difficult to distinguish whether the shortfall was due to system errors, human faults, or process bottlenecks. In a highly volatile, fast-paced environment governed by strict railcar loading schedules, relying on end-of-day volumetric tallies meant that by the time we realized we were losing throughput, the shift was over, and the opportunity to prevent costly rail demurrage fees was already gone.
To solve this, we had to abandon the discrete manufacturing paradigm entirely. By partnering with our internal automation engineers, IT department, and maintenance teams, we built a throughput-based OEE model embedded directly into our customized Yard Management System (YMS).
Building the model: Primary constraint and the 5-minute rule
To create a functional OEE model for bulk flow, you cannot track every single spout or conveyor; you must identify the facility's primary mechanical constraint. After spending extensive time on the floor watching and measuring cycle times for every piece of equipment, we established the bucket elevator as our primary measurement point. Because it moves product vertically, it is the fundamental mechanical artery that dictates capacity across all processes in the facility: unloading, blending, and transferring.
However, relying strictly on a programmable logic controller (PLC) to indicate motor status is insufficient, as a leg can run entirely empty. We established undeniably “Proof of Flow” by integrating the PLC status directly with the localized bulk weighing scale. Discrete drops, or “drafts,” falling from the bulk scale represent conclusive evidence of productive material movement.
To ensure accuracy, we had to account for the physical realities of continuous flow. In traditional manufacturing, any time a machine runs without producing a part, it hurts your performance score. But in a grain elevator, there are “blind process movements.” It takes a few minutes for the gates to open, the belts to reach velocity, and the product to physically transit vertically before falling into the scale.
To avoid falsely penalizing operators for basic physics, we established a strict five-minute no-flow timeout. If the scale goes more than 300 seconds without registering a completed draft, the system retroactively overrides human reporting, categorizing that time as “No-Flow Downtime” only. This automated logic cleanly captures transient micro-stoppages that human operators consistently fail to document, eliminating manual reporting bias.
Categorizing time and uncovering hidden bottlenecks
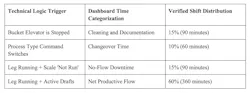
Once integrated, the YMS dashboard categorizes every second of a standard 10-hour (600-minute) shift into four mutually exclusive buckets (see Figure 1):
Almost immediately, this automated daily data revealed a massive hidden bottleneck. We noticed that our “changeover” bucket was accumulating significantly lost time. Individually, the transition time required to switch from receiving to blending, or vice versa, seemed negligible on the floor. But the dashboard proved that these small, frequent changeovers were compounding into massive blocks of non-value-added downtime over a 24-hour cycle.
Armed with clear data, management took immediate action. We restructured our process schedules and authored highly specific, standardized plans to drastically reduce daily changeovers. We stopped losing time on non-value-added transitions, instantly increasing our overall utilization.
Operational and supply chain economic impact
These automated timeouts also reveal massive lost production opportunities. A shift suffering from 15% No-Flow Downtime sits idle for exactly 90 minutes. A standard rail hopper car utilized in agricultural transport carries roughly 3,500 bushels of grain. Losing 90 minutes of flow is equivalent to missing the opportunity to load four rail cars, resulting in a shipping shortfall of 14,000 bushels. Valued against an assumed $4.28/bu bulk commodity price, this represents approximately $60,000 in delayed revenue per shift.
Furthermore, Class I railroad tariffs actively penalize these internal bottlenecks. Under verified Union Pacific Tariff 6004, the standard “Chargeable Events Demurrage” for holding railroad equipment within a serving area beyond the allowed free time is exactly $240 per car per day. [1][2] Chronic No-Flow Downtime quickly compounds thousands of dollars in weekly logistical fines.
The 100% performance cap: Prioritizing safety and thermodynamics
In discrete manufacturing, operators are frequently incentivized to exceed quotas. In continuous bulk processing, baseline metrics must anchor strictly to engineering safety values. The throughput model enforces an absolute mathematical performance cap at exactly 100% of engineered capacity. If a system engineered for a safe rate of 10,000 bushels per hour (bu/hr.) processes more than that target due to aggressive operator feeding, the OEE score remains exactly 100.0%. Capping the metric eliminates the dangerous incentive for crews to overspeed bucket elevators beyond design limits.
Systematic over speeding accelerates mechanical wear, generating extreme friction and heat in overworked bearings. It also increases the kinetic force within the enclosed leg system, breaking grain and generating suspended, combustible fugitive dust. An overheated bearing combined with fugitive dust provides the exact thermodynamic conditions required to trigger a catastrophic secondary explosion.
According to the 2025 agricultural dust explosion report authored by Dr. Kingsly Ambrose at Purdue University, the U.S. agricultural industry experienced seven major grain dust explosions last year.[3] These catastrophic incidents resulted in 10 severe injuries and four fatalities a sharp and concerning escalation from zero fatalities the prior year.[3][4] The probable ignition sources identified were definitively linked to mechanical strain, including overheated bearings and equipment maintenance issues, with grain dust serving as the primary fuel source.[3] Capping OEE metrics at 100% is not a mathematical preference; it is a proven, life-saving operational mandate.
Furthermore, when the system is legitimately stopped for mandatory sanitation protocols, it falls into a protected “Cleaning/Documentation” bucket. Operators are never mathematically penalized in their OEE scores for halting production to comply with critical food safety requirements.
Shift-to-shift diagnostics
Real-time digital dashboards transition management from a reactive posture to proactive diagnostics. Consider the diagnostic power of the throughput model across varied shifts operating on a 10,000 bu/hr. target system:
- First Shift: Accrues only 30 minutes of No-Flow Downtime and processes product at 10,050 bu/hr. The system strictly caps the true OEE score at 100.0% to prevent unsafe mechanical over speeding.
- Second Shift: Experiences 90 minutes of No-Flow Downtime during an 8-hour shift. This leaves only 6.5 hours of active running time, capping their maximum potential yield at 65,000 bushels. Dividing 65,000 bushels by their 8-hour shift drops their overall average throughput to 8,125 bu/hr., resulting in a strictly calculated 81.25% OEE. Management immediately recognizes that engineering intervention is required to identify hidden bottlenecks causing runtime idle time.
- Third Shift: Experiences only 15 minutes of No-Flow Downtime but achieves a slow rate of 8,250 bu/hr. (82.5% OEE). Operators exhibit excellent time management but require direct coaching to safely optimize feed rates closer to nameplate capacity.
Calculating daily OEE (accumulation method)
To accurately benchmark 24-hour facility performance, engineers must avoid the fatal mathematical error of simply averaging individual shift percentages. Averaging assumes every shift possesses an identical volumetric weight and planned running times.
Accurate daily reporting requires strict adherence to the Accumulation Method. All raw base metrics, operating minutes, volumes moved, and target capacities must be summed across the entire 24-hour period before the final calculation.
DAILY OEE = (TOTAL ACTUAL VOLUME PROCESSED) / (ABSOLUTE MAX TARGET VOLUME FOR THE 24 HOUR PERIOD)
For example, if a 24-hour facility targeting 10,000 bu/hr. accumulates 21 hours of active run time and processes a total of 174,000 actual bushels, the math is straightforward. You bypass arbitrary shift percentages and divide the accumulated actual volume (174,000 bushels) by the absolute maximum 24-hour target volume (240,000 bushels) to instantly achieve a true Daily OEE of 72.5%.
Changing the conversation: Real-world ROI
Since rolling out this throughput-based YMS dashboard at Ardent Mills, the ROI can be measured in many different areas. We have observed a marked increase in overall throughput, a drastic reduction in railcar loading times, lower demurrage fees, and far better labor and asset utilization.
Most importantly, the culture has transformed. Often, new digital tracking systems make employees feel micromanaged, but our operators embraced the dashboard. Their goal was always to be efficient; they just didn't have the tools to prove what was actively holding them back.
Today, our morning meetings are entirely data driven. There is no more guesswork about what technical difficulties occurred the day before. By shifting from lagging, manual reports to leading, real-time automated metrics, we can easily identify root causes and work collaboratively as a team to proactively optimize today's production capacity.
About the Author
Akhilesh Korpe
Akhilesh Korpe is an operations supervisor at Ardent Mills, LLC, and an independent researcher focused on bulk material handling optimization and continuous flow processes. Connect with him on LinkedIn at www.linkedin.com/in/akhilesh-korpe.