Maintenance Mindset: How to choose the right statistical test for maintenance and reliability data
Key Highlights
- Proper statistical analysis begins with understanding the specific comparison being made.
- Common mistakes often stem from asking the wrong questions or forcing data into inappropriate frameworks.
- Different types of comparisons—independent groups, paired data, multiple groups, or time-based measurements—require specific statistical tests such as t-Tests, ANOVA, or Repeated Measures ANOVA.
- A disciplined approach to statistics helps industry professionals distinguish real effects from normal variation, supporting better decision-making and operational improvements.

Growing up, I didn’t realize just how smart my father was and what sort of math savant he was. He enlisted in the Army to fight in World War II before he graduated high school, and after his service, he never finished school, opting instead to work in the print shop as an apprentice. The shop was for Underwater Warfare, and the facility focused on sonar and weapon systems for the new Nuclear Submarine force. He spent almost 40 years there, eventually retiring as a supervisor. He was privy to all the scientific and engineering reports that would be sent to the Pentagon.
During his retirement party, I was surprised at the number of Navy officers, scientists, and engineers that attended and how many told me how smart my father was. Apparently, he would find mistakes in their calculations and ask permission to correct them. We knew growing up that his ability to do math in his head seemed natural yet only to him, and frankly, I felt as if I had a learning disability in comparison! We were all baseball fans and his instant ability to rattle off their on-base and slugging percentage as the game progressed was common fair. While most concerned themselves with batting averages, runs batted in, and earned run averages, he knew the defensive runs saved (DRS), outs above average (OAA), and ultimate zone rating (UZR). He was ‘Money Ball’ before there was money ball. This was my first introduction to statistics, and he would often say ‘statistics don’t lie, but liars use statistics.’
Example 1: Lubricant evaluation
Compare gearbox life between synthetic and mineral lubricants using an Independent t-Test.
Step 1: Define the comparison.
The comparison is between two unrelated groups: gearboxes using synthetic lubricants and gearboxes using mineral lubricants.
Step 2: Define the response variable.
The measured outcome is gearbox life, usually expressed in operating hours before failure, rebuild, or removal from service.
Step 3: State the question.
Does the synthetic lubricant produce a different average gearbox life than the mineral lubricant?
Step 4: Select the test.
Because the two groups are independent, an independent t-Test is appropriate.
Step 5: Interpret the result.
If the p-value is small, the difference in gearbox life is likely meaningful. If the p-value is large, the observed difference may simply be normal variation between gearboxes.
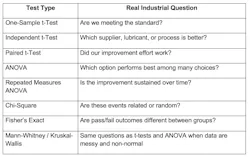
Statistics is fundamentally about comparison. The challenge is not choosing a statistical package. The challenge is identifying exactly what is being compared.
Most statistical mistakes do not originate from mathematics. They originate from asking the wrong question. Engineers often begin with a desired statistical test and then attempt to force the data into that framework. The more productive approach is to first identify the comparison of interest and then select the appropriate statistical tool. Once the comparison is properly defined, the choice of test often becomes obvious. Let’s take a look at several ways where statistics can be used and why.
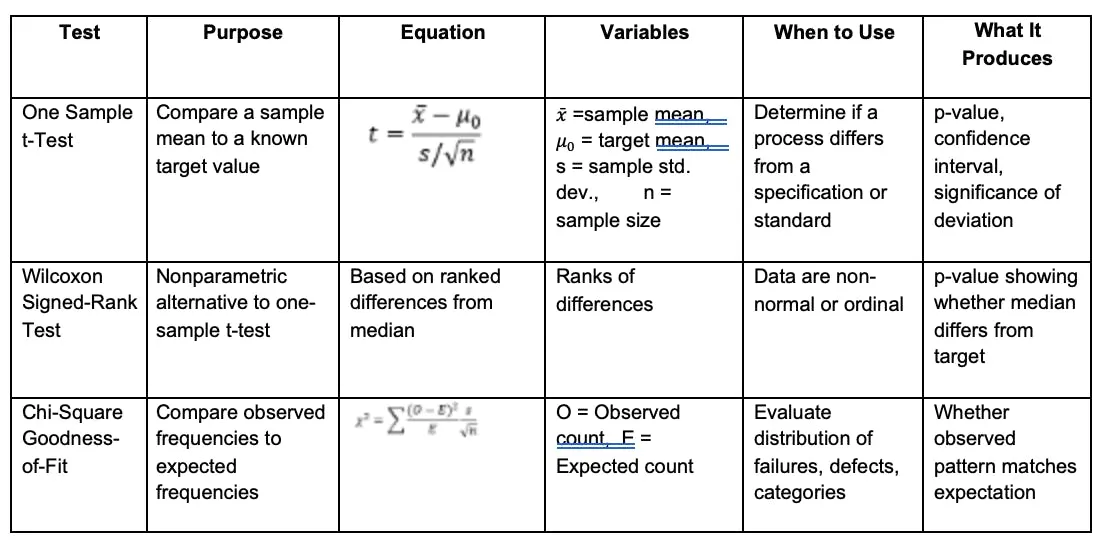
Comparing one group to an expected value: Hydraulic fluid viscosity
Sometimes the question is whether a process differs from a known target, specification, or historical benchmark. In these situations, there is only one group of observations, and the comparison is between what was observed and what was expected (see Figure 1).
Take, for instance, a lubricant blending facility. They may specify that the viscosity of a finished hydraulic fluid should average 68 cSt at 40°C. Twenty-five samples are collected from production and analyzed. The question is not whether the samples differ from one another. Variation among the samples is expected. The question is whether the average viscosity differs from the target value of 68 cSt.
Example 2: Precision Lubrication Program
Compare motor temperatures before and after implementation using a Paired t-Test.
Step 1: Define the comparison.
The comparison is between the same motors before and after the lubrication program.
Step 2: Define the response variable.
The measured outcome is motor operating temperature.
Step 3: State the question.
Did the precision lubrication program reduce motor temperature?
Step 4: Select the test.
Because each motor has a before and after measurement, the data are paired. A Paired t-Test is appropriate.
Step 5: Interpret the result.
If the average temperature difference is statistically significant, the program likely produced a real improvement. If not, the apparent reduction may be ordinary operating variation.
Comparing two independent groups: Two lubrication recommendations
Many industrial decisions involve choosing between alternatives (see Figure 2). Two suppliers may provide the same component. Two lubricants may be proposed for the same application. Two plants may produce the same product using different operating practices.
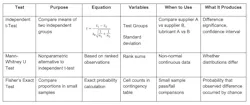
A reliability engineer evaluating gearbox performance may compare bearing life achieved using two different gear oils. The bearings lubricated with Oil A have no relationship to the bearings lubricated with Oil B. They are separate populations. Likewise, a procurement team may compare defect rates from Supplier A and Supplier B. A refinery may compare catalyst performance from two manufacturers. A training department may compare certification scores from employees who completed classroom instruction versus those who completed online instruction.
The common characteristic is independence. The observations in one group do not correspond to observations in the other group.
Example 3: Grease Comparison
Compare bearing temperatures among lithium complex, calcium sulfonate, and polyurea greases using ANOVA.
Step 1: Define the comparison.
The comparison involves three independent grease groups.
Step 2: Define the response variable.
The measured outcome is bearing operating temperature.
Step 3: State the question.
Do the three grease types produce different average bearing temperatures?
Step 4: Select the test.
Because there are three independent groups, ANOVA is appropriate.
Step 5: Interpret the result.
If ANOVA indicates a significant difference, at least one grease performs differently. A follow-up comparison is then needed to determine which grease differs from the others.
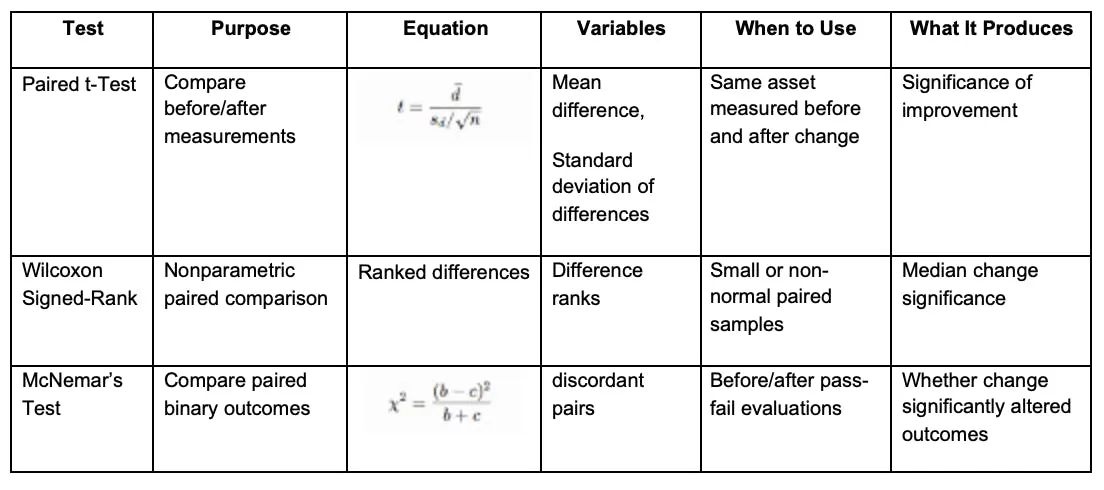
Comparing two paired groups: Different states of the same machine
Sometimes the comparison is not between different populations but between the same population measured twice (see Figure 3).
A plant installs a kidney-loop filtration system on a hydraulic reservoir and wishes to determine whether cleanliness improved. The cleanliness measurements before filtration and after filtration are linked because they come from the same reservoir. Similarly, a maintenance team may measure vibration before and after laser alignment, energy consumption before and after an optimization project, or leak rates before and after a seal replacement.
The comparison is not between different machines. It is between different states of the same machine. Because the observations are naturally paired, the statistical analysis must account for that relationship.
One of the most common mistakes in industry is treating paired data as independent data. Doing so discards information and often obscures the true effect of intervention.
Eample 4: Hydraulic Cleanliness Improvement
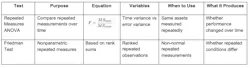
Compare ISO cleanliness codes over several time periods using Repeated Measures ANOVA.
Step 1: Define the comparison.
The same hydraulic system is measured repeatedly over time.
Step 2: Define the response variable.
The measured outcome is ISO cleanliness code or particle count level.
Step 3: State the question.
Did hydraulic cleanliness improve over time after corrective actions were implemented?
Step 4: Select the test.
Because the same system is measured at multiple time points, Repeated Measures ANOVA is appropriate.
Step 5: Interpret the result.
If the result is significant, cleanliness changed over time. The practical question then becomes whether the change reflects sustained improvement or only temporary cleanup.
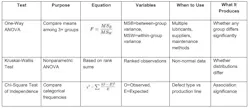
Comparing three or more independent groups: Production yields among plants
Industrial organizations rarely evaluate only two alternatives. More often there are multiple options competing for selection (see Figure 4).
A mining operation may evaluate four grease formulations for haul-truck wheel bearings. A manufacturing company may compare production yields among five plants. A utility may assess transformer oil performance from three suppliers. A reliability team may compare the effectiveness of preventive, predictive, and run-to-failure maintenance strategies.
Each group represents a separate population. The objective is to determine whether at least one group differs significantly from the others. If a difference exists, additional analysis can identify where those differences occur.
The practical value of this comparison is substantial because many industrial decisions involve selecting the best option from several candidates rather than merely choosing between two.
Comparing three or more dependent groups: Performance change overtime
Some of the most valuable industrial data is collected over time. Here, the same population is measured repeatedly as conditions evolve (see Figure 5).
A reliability engineer may monitor machine vibration monthly for a year following a rebuild. A process engineer may record production yield at the end of each quarter after implementing process improvements. A laboratory manager may track analytical accuracy across multiple audit cycles. An energy manager may evaluate electricity consumption before implementation, six months afterward, and one year afterward.
These observations are connected because they originate from the same system. The goal is not simply to determine whether differences exist, but whether performance is changing over time and whether those changes represent meaningful trends rather than ordinary variation.
In many respects, this form of comparison is closest to how industrial systems behave. The question is often not whether a system is different from another system, but whether the same system remains the same as time passes. Once the comparison is correctly identified, the statistical pathway becomes clear. Statistics are not primarily a collection of equations, it is a disciplined framework for determining whether observed differences are meaningful. That process always begins by understanding exactly what is being compared.
What each test really answers
The sidebars throughout are examples for industrial examples with step-by-step statistical thinking for comparing gearbox life, motor and bearing temperatures, hydraulic cleanliness, and calibration verification.
The important point is that the statistical test follows the comparison. A good analyst does not begin by asking which button to press in software. The analyst begins by asking what is being compared, whether the data are independent or paired, how many groups exist, and whether the comparison is against another group, against time, or against a known standard.
Example 5: Laboratory Calibration Verification
Compare measured viscosity against a certified reference value using a One-Sample t-Test.
Step 1: Define the comparison.
One set of laboratory measurements is compared against a known certified value.
Step 2: Define the response variable.
The measured outcome is viscosity.
Step 3: State the question.
Is the laboratory’s measured viscosity significantly different from the certified reference value?
Step 4: Select the test.
Because one sample mean is being compared to a known value, a One-Sample t-Test is appropriate.
Step 5: Interpret the result.
If the result is significant, the instrument, method, analyst, or calibration system may require investigation. If the result is not significant, the laboratory result is statistically consistent with the certified value.
About the Author
Michael D. Holloway
5th Order Industry
Michael D. Holloway is President of 5th Order Industry which provides training, failure analysis, and designed experiments. He has 40 years' experience in industry starting with research and product development for Olin Chemical and WR Grace, Rohm & Haas, GE Plastics, and reliability engineering and analysis for NCH, ALS, and SGS. He is a subject matter expert in Tribology, oil and failure analysis, reliability engineering, and designed experiments for science and engineering. He holds 16 professional certifications, a patent, a MS Polymer Engineering, BS Chemistry, BA Philosophy, authored 12 books, contributed to several others, cited in over 1000 manuscripts and several hundred master’s theses and doctoral dissertations.