Performance measurement is one of the methods at the heart of propelling an organization towards breakthrough performance. This generally takes the form of performance indicators, key performance indicators, and measurement programs all designed to focus the attention on various areas of performance.
Within the Maintenance Scorecard, MSC, the approach taken is to create metrics based on desired performance levels, rather than employing some form of measurement by pick-list approach to building a metrics program.
The old adage is “if you can measure it you can manage it”. The Maintenance Scorecard takes a slight turn from this. Before you think about how to measure it, first work out what it is you want to manage!
Regardless of the approach taken, at some stage the organization finds itself considering some of the advanced techniques within performance measurement. These include strategic theme key performance indicators, leading and lagging indicators, opposing indicators, risk-based indicators, and modern display techniques.
Within this short article I am going to try to clarify how Leading and Lagging indicators are treated within the Maintenance Scorecard, and how they can add immediate value to your companies’ performance management efforts.
What exactly are Leading and Lagging Indicators?
It pays to remember that we are talking about measuring and managing performance within this area of the discipline. So we need to directly relate these titles back to the measurement of performance.
Quite simply leading indicators lead performance, and Lagging indicators lag performance. In other words, one tells you where the performance of your assets, teams, processes, or other resource, is going to, and allows you to act in a proactive manner. While the other tells you where it has been, and allows you to take reactive action!
At first glance this seems counter-intuitive doesn’t it. How can we measure things that have happened, and think we are going to be able to predict future performance levels? The trick is to fully understand the processes you have in place, and how that fits into the rest of your day-to-day management of the physical asset base.
Some examples of Leading Indicators
So, Leading indicators allow you to take action proactively. So to truly be a leading indicator they need to predict, or provide some indication, of future performance levels and/or issues.
For example: most work order systems are managed through some form of priority rating of the corrective, or reactive, work orders in progress. This rating is often related to time and is used to determine how soon after creation the work order should be done.
It is used in capacity scheduling, ad-hoc work order execution and a range of other business processes that have to do with work management. The basis of this process is a link to time. This is done, normally, using a combination of the consequences of the failure mode if it is left unattended to, and the importance of the equipment to the company.
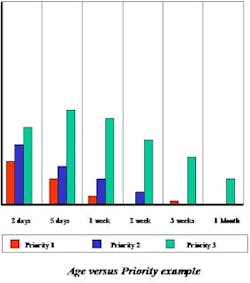
Within this process a performance indicator, or report, would be the Age vs. Priority Report. This report displays the number of work orders, in their respective priority groupings, that have not been completed on time. Some of these also display how late the work order is.
Figure 1: Age versus priority example
The graph in figure 1 clearly shows that a number of Priority1 work orders are between 5 days and 1 week late. In this case we don’t know what the time horizon is for Priority 1 work orders. But it is probably less than one week! If you look at the 3-week mark on this graph one or two have made it out this far. Not good!
So, what is this telling us? It really depends on the underlying work order prioritization method being used. But basically it is indicating that we are faced with a higher level of risk than our system is supposed to manage. This probably means that something is about to fall apart within the very near future.
This metric, as with any other, should be produced in such a way as to be able to drill down into the data that produced it. This would take us to the late work orders, the equipment they were raised on, the failure mode, or potential failure, that has triggered them and possibly even the consequences of them going horribly wrong.
This is the essence of leading indicators; they tell you where performance is likely to go. Things aren’t bad in the priority example yet, but it looks like they soon will be! If used correctly leading work orders can add a proactive element to what is normally a reactive activity.
Leading performance indicators are few; the best proactive measures come from a specific need within a specific company, rather than selecting from a range of “off-the-shelf” measures.
Schedule compliance (Yup, that one) is a good example of another leading indicator. (But with a twist) Normally this metric is used to evaluate how the scheduling and execution functions are working together, how the workload is being managed, and as an indicator to how much unexpected work occurred and pushed it out.
For instance: from RCM we learned that an On-condition task is scheduled to occur at a frequency less than the P-F Interval. I won’t go into why as that is a whole different area, but for the sake of this article we will take this as the principle.
Therefore there is only a limited timeframe for the on-condition or predictive task to be carried out. If the P-F Interval is 4 weeks, the frequency of inspection is, say, two weeks, and the actual inspection frequency is 6 weeks. Then we can see immediately that we are only going to predict this failure mode occurring by dumb luck!
Once is okay, we can react to that, but if the task is regularly done at periods longer than the P-F interval then the most likely outcome is that we will have an unpredicted failure on a failure mode that our analysis told us needed to be predicted.
Again, the underlying concept is a deep understanding of what it is that your processes and regimes are trying to accomplish, and the effects of these on other areas of performance. And again a standard metric can be used to give a vastly different viewpoint.
Some examples of lagging indicators
Lagging indicators are just about all of the rest. These are indicators that tell you when something has gone wrong or is in the process of going wrong. MTBF, Availability, Planned versus reactive ratios (if these are still used) are all examples of lagging indicators.
Although we have spent most of this paper on leading metrics, that these are also very important. Without lagging indicators we have no idea of the impact, good or bad, of the work we are doing on a daily basis, or of the improvement initiatives, or of recent modifications and so on.
About the Author
daryl.mather
daryl.mather
Sign up for our eNewsletters
Get the latest news and updates

