Lessons learned from the I.M. Pei library: How continuous optimization can be the key to efficient operation
Note: This article is the second in a series of case studies of buildings that we managed in Columbus, IN that had been designed by world-class architects. Read Case Study #1 here.
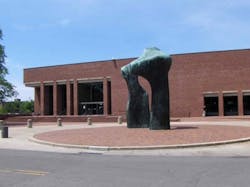
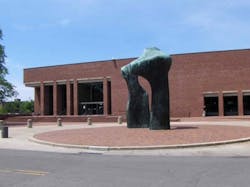
Of all of our projects in buildings designed under the Architectural Program in Columbus, the I.M. Pei library with the Henry Moore arch out front was my favorite. The 87,000 square foot building was first occupied in 1969. Designed by one of the finest architects on the planet, it exuded quality inside and out. The mechanical systems were first class. HVAC equipment included a centrifugal chiller, cooling tower, large air handlers, electric heating coils, humidifiers, pumps, control panels, etc.
Anyone would expect a 15-year-old architectural masterpiece with energy systems designed by the finest building professionals in the world to be the model of energy efficiency. However, before we got involved, it had been using 50% more energy than it should have. Why?
Limits of standard design process to drive building energy efficiency
The operation and maintenance (O&M) manuals, control schematics, sequence of operation, and other documents produced during the design phase can only be guidelines for the average facility or energy system. However, as I described in my blog post “Every Building is Unique”, there are no average facilities.
No matter how good the practitioners, there is no way to know during the design phase how the energy systems should be operated for peak efficiency in the resulting fully commissioned facility. All of my experience has confirmed that the most efficient operation can only be determined through a Continuous Improvement Process using extensive instrumentation and engineering analysis after the building is in full operation.
Recognizing this flaw in the standard design and construction process, a new field called Building Commissioning was developed by PG&E and continued in the 1990s by the California Institute for Energy Efficiency and Lawrence Berkley Labs. The Building Commissioning Association released a report in 2006, “Best Practices in Commissioning Existing Buildings” describing “a systematic process for investigating, analyzing, and optimizing the performance of building systems.” To my disappointment, at the very end, it recommends re-commissioning every 3 to 5 years, whereas I had expected the process to be continuous.
The prevailing energy management culture has been driven for a long time by the DOE, utility companies, and professional organizations which together have developed a very expensive and inefficient process of energy audits, benchmarking, simulation software, capital projects and “estimating” costs and savings. Relying on non-scientific methods that literally haven’t changed since the mid-1970s, these traditional energy conservation and commissioning techniques have been a huge source of revenue for many in the energy efficiency profession. However, none of these actions require the use of permanent instrumentation to show where and when every kwh, therm, or gallon of water is used.
As a result, the entire process has missed the best opportunity to create the greatest savings with the fastest paybacks – continuous optimization of existing energy systems in existing facilities. Indeed, in industrial plants, energy conservation efforts have been almost entirely focused on selling and installing new lights, one of the smallest users in all energy-intensive plants. (See my blog post “Lighting Projects Confirm Lack of Qualified Energy Professionals.”)
Results of applying continuous optimization to the I.M. Pei Library
We have been proving in every project for nearly 40 years that permanent instrumentation with sophisticated analytics provides all of the information required to operate total facilities and their energy systems most efficiently on a continuous basis. By installing an energy monitoring system as the first step in every project, there is no need to waste precious resources on all of those other actions.
In the case of the I.M. Pei library, even though this exceptional facility was being operated as specified by the original designers, it wasn’t being operated efficiently. By applying continuous optimization techniques to all significant energy systems, the annual energy costs were reduced by 35%. Specific results included the following:
- The Cooling System was Oversized. A 300-ton centrifugal chiller had been provided for air conditioning. During the 10 years we operated the building, data from our monitoring system showed that the chiller normally operated about 30% loaded, which was in the lower efficiency area of the chiller performance chart. The highest load recorded was less than 200 tons on a 95°F day when the building occupancy peaked during a music festival. The pumps, cooling towers, and air handlers had all been sized for a peak load of 300 tons. Not only had the owner spent money to buy cooling equipment larger than needed, the oversized equipment used more energy than required every hour it was operated.
- The Library was a Massive Thermal Storage System. The brick building had concrete floors, a minimum amount of glass, and thousands of books. It was built like a cave and easy to maintain at a constant temperature. The walls absorbed heat from the sun, outdoors, lights and occupants during the day while the interior stayed cool. At night, the heat was released, cooling the walls. But the air conditioning system had been designed and operated as if it were in a building with little mass. The designers had assumed that the load on the system was directly related to outdoor temperature and humidity, sun loads, lights and occupants. The calculations to size the system had been based on that assumption, not on the actual needs of the facility. The operation ignored both the opportunity for free cooling during much of the six-month cooling season and the ability of the building mass to shift cooling loads from day to night to take advantage of the free cooling and minimize the operation of the air conditioning system.
Optimizing the operation to take advantage of the mass
We added temperature and humidity sensors both indoors and out. Our software looked at all of them and controlled the fresh/return air dampers to return the air with the lowest energy level. During spring, fall and often during nights in the middle of the summer, the temperature and humidity in Columbus are low and suitable for cooling without running the chiller, associated pumps and tower fan.
Rather than turning off the air handlers an hour after closing and retaining the 74-76°F space temperature all night, we opened the fresh air dampers 100% and ran the air handlers for as long as it took to flush out the heat from the building and pre-cool the mass for the next day. The run times of the chiller, pumps and tower were reduced from 15 hours a day to less than 4 during most days during the cooling season. Some days, they didn’t run at all.
Our projects have included compressed air systems, plastic injection molding presses, refrigeration systems, melting furnaces, concrete mills and more. Read the Case Studies.
To share this opportunity that is available in every facility, I have written a book titled, “How to Unleash the Power of Energy Monitoring in Your Facility”. It can be downloaded for free at: http://www.holmesautopilot.com/resources/energy-monitoring-book/
About the Author
Alexis Gajewski
Senior Content Strategist
Alexis Gajewski has over 15 years of experience in the maintenance, reliability, operations, and manufacturing space. She joined Plant Services in 2008 and works to bring readers the news, insight, and information they need to make the right decisions for their plants. Alexis also authors “The Lighter Side of Manufacturing,” a blog that highlights the fun and innovative advances in the industrial sector.

