Loop assessment is a great way to boost overall plant performance
Loop assessment, performance analysis and diagnostics have received considerable attention in recent years. Surveys have reported significant room for improvement in plant operations if an effective loop maintenance policy is adopted. One multi-industry loop audit survey reported that only about 32% of loops have acceptable or excellent performance. According to another survey, many industries are adopting some form of condition-based maintenance (CbM) as a predictive maintenance policy. Plant-wide maintenance practices have adapted to an ever-increasing demand for productivity. Industry needs a set of guidelines and strategies that leverage technological developments and maintenance productivity tools to increase overall production efficiency.
Loop assessment = predictive maintenance
Predictive maintenance requires using process diagnostics and performance analysis to focus maintenance resources on high-priority components with the greatest return on investment before they become intolerably faulty and chances for unscheduled shutdowns are high. Even though vendors and research academicians have developed indices to assess loop performance, questions remain:
• At what point does low performance indicate a problem?
• Which problematic loops provide the most room for improvement?
• For which problematic loops will maintenance maximize ROI?
The answers might alter one’s choice of predictive maintenance tools or assessment indices. Consider auto-correlation analysis of a process value to evaluate a loop, an assessment index that only can be evaluated or measured off-line. These activities usually need expert engineering, the most costly maintenance resource. Using engineers to evaluate loop performance using off-line software tools is a practice that could prove to be cost-prohibitive on a plant-wide basis. A key to predictive maintenance is identifying problematic loops offering the greatest ROI without using engineering effort. Industry has responded with online threshold and threshold violation schemes to identify problematic loops, efforts to define economical KPIs that can be related to loop performance indices and assigning priorities to the most critical loops.
But, evaluating and ranking certain high-level assessment indices for loops plant-wide can identify problematic loops that present the greatest maintenance ROI.
Loop as a controller
Traditionally, the term loop refers to a single controlled process, its feedback controller and related devices. Although it’s good to explore single-loop performance and to diagnose its faults, it’s not appropriate for plant-wide performance analysis. Predictive maintenance strategies should:
• Identify automatically the problematic loops that present the best opportunities for improvement on a plant-wide scale.
• Isolate loop faults with further tests and analysis.
• Provide remedies for faults and performance improvement.
Looking at loops as a cut on automation hierarchy and as a component in a plant-wide structure can help to devise an effective predictive maintenance strategy.
Loop as a cut of automation hierarchy
Most manufacturing plants are automated, and the system components can be organized into the following hierarchy:
• Main process.
• Device level (sensors, actuators and communication devices).
• Control level (algorithms such as PID, IMC and MPC).
• System level (automation programs in a PLC, DCS or PC).
• Supervisory level (HMI, recipe management, alarm management and optimization engines).
• User level (production operators and engineers).
This organization is based on the logical depth of system layers that fall between an operator – the highest level – and the underlying process of interest – the lowest level (Figure 1). For example, to introduce a change in the process, an operator first changes the setpoint field in an HMI level. This, in turn, changes some data located in the PLC, which translates into a setpoint change in a PID equation. Such a change, depending on the current value of the process variable, could introduce a controller output change that modifies a valve opening, which affects the process.
| Fault mode | Level II: Device level: plant devices such as sensors, valves, actuators and communication networks | Level III: Regulatory control level: implemented in mathematical algorithms such as PID, IMC, MPC | Level IV: System level: project implementation in PC, PLC and DCS platforms | Level V: Automation level: PC-based supervisory control, project implementation in HMI; alarm management, recipe control, optimization engines | Level VI: User level: human process operators |
| Level I: Main process: chemical reaction Process / raw material disturbances Process non-linearity Off-spec product / incomplete chemical reaction Abnormal (or out of range) process conditions, e.g. pressure / temperature too high (or low) |
communication networks Sensor disconnection Sensor excessive noise Sensor over-span Sensor under-span Sensor bias Sensor drift Valve disconnection Valve oversize Valve undersize Valve hysteresis Valve stiction Valve deadband Valve nonlinearity Valve backlash Network disconnection |
Overly aggressive controller tuning Overly sluggish controller tuning Sustained controller saturation Insufficient control strategies |
System disturbances Multiple loop interactions |
Excessive alarms Recipe inconsistencies |
Excessive user-initiated setpoint changes Excessive user-initiated manual operations |
We propose to extend this view of a loop to incorporate all six levels. As an example, consider a reactor temperature control loop. In this expanded view, the reaction, temperature sensors, heating elements, device networks, PID algorithm, PLC program, PLC and PC system and programs, related recipe management program, corresponding HMI fields and human operators who interact with the reaction are functional loop components.
This view expands upon notions like loop fault modes, loop assessment indices and loop performance monitoring. Table 1 lists a few loop fault modes or problematic attributes at each level of hierarchy. More importantly, based on some observations of fault behaviors, one could arguably devise a more effective loop maintenance strategy for the entire plant.
Analysis of assessment indices
To maximize return on maintenance, we need to leverage new technologies, use automated and formalized loop assessment methods, perform online rather than off-line analysis, perform maintenance based on priorities and process criticality and, finally, do it where there’s the most room for improvement.
Many loop problems appear in the lowest level of the automation hierarchy. The problems first manifest themselves in drift, performance deterioration and the assessment indices for the corresponding levels. As problems diffuse upward, they affect performance indices at higher levels. Thus, deterioration in an assessment index for a higher level could indicate a more severe problem in a lower hierarchy level. In fact, the assessment indices for the higher levels could help identify problematic loops, the repair of which provides a better return on maintenance effort.
Consider a process disturbance. Although it’s a problem, it will be negligible if it’s smaller than sensor resolution. As the amount of disturbance increases, the process sensors will detect it. Thus, we have a diffusion of a problem from a low level to a higher level. If the disturbance continues to be severe, the regulatory control fails to reject it completely. Further increases in disturbance could possibly produce loop interactions at system levels and push the loop into alarming regions.
Problem severity at a lower level affects assessment indices at supervisory levels. It’s reasonable to assume that a persistent, severe disturbance that regulatory control couldn’t reject – possibly from slow controller tuning – stimulates human operator reactions.
The operator might put the controller in manual mode and make excessive adjustments trying to reproduce the behavior of a fast, disturbance-rejecting controller. That changes the assessment indices for this level of hierarchy (the percent of the time the loop operates in manual mode).
As another example, consider a recipe implemented in a loop’s supervisory level. A sub-optimal recipe usually wastes raw material and energy. If the recipe conflicts with the underlying material and energy balance – a fault mode in the supervisory level – various controllers will fight, each trying to maintain its individual setpoint. Controller infighting could diffuse the problem to lower levels. It’s also likely that the operator will change setpoints by trial and error to remove inconsistency, a behavior that degrades a user-level assessment index that measures the average number of operator-induced setpoint changes. Obviously, a recipe inconsistency provides opportunity for saving material and energy. Therefore, assessment index deterioration at higher levels provides the most return on predictive maintenance efforts.
As a final example, consider a valve hysteresis problem – a fault mode residing in Level I. well-established step tests determine if a valve exhibits hysteresis, but performing them at large scale is impractical. A hysteresis below 1% of valve movement span is, in most cases, considered negligible. However, a severe hysteresis problem represents a potential for more return on maintenance investment.
Linear controllers such as PID can’t reject hysteresis, which manifests itself as a persistent oscillation around a setpoint. This, in turn, could noticeably degrade assessment indices for the higher regulatory control of Level III (average number of setpoint crossings). If hysteresis becomes intolerable, the operator might put the loop into manual mode and thus degrade the assessment indices in Level VI.
An effective strategy for identifying the loops that provide a better return on the maintenance effort could start with higher-level performance indices and move to lower-level performance indices. In other words, the maintenance effort should be focused on loops exhibiting problems and deficiencies in the higher-level assessment indices.
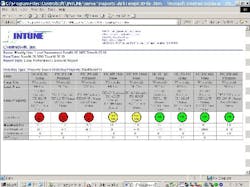
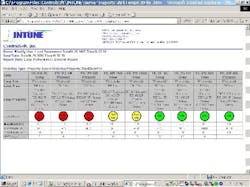
Available tools define and evaluate a rich set of assessment indices for the higher levels of loop hierarchy using a moving-window averaging scheme, and generate reports that rank the loops according to assessed indices. These productivity tools can support predictive maintenance strategies with minimal requirements for human experts.
Assessment indices defined for the regulatory and device levels, including standard deviation error, process variability, disturbance, noise band and optimal loop quality index, also could be used to determine the need for maintenance and prioritizing maintenance activities.
Bottom-up analysis
Once a problematic loop is identified, it’s important to isolate the root cause of assessment index deterioration. This step is called fault diagnosis. An effective process for loop fault diagnosis could start with isolating low-level fault modes, then move toward fault modes at higher levels. It implies resolving Level II faults modes such as excessive sensor noise, valve hysteresis and stiction and moving to Level III fault modes such as PID tuning, followed by adding appropriate strategies for disturbance rejection and multiple input and multiple output systems to remedy loop interaction.
This bottom-up fault isolation process is essential because many lower-level faults manifest themselves in a higher-level assessment. Although not preferable, one could use some loop-intrusive test procedures at this stage to diagnose the loop’s main fault mode.
Alireza Haji-Valizadeh is technology development manager at ControlSoft Inc. in Highland Heights, Ohio. Contact him at 440-443-3900.
Read the second part of this article here.
| Hank Brittain, “Performance Assessment for Management,” Proceedings of ISA EXPO 2003, ISA Volume 439, ISBN 1-55617-882-4. Lane Desborough and Randy Miller, “Increasing Customer Value of Industrial Control Performance Monitoring – Honeywell’s Experience,” Proceedings of Sixth International Conference on Chemical Process Control, Jan. 2001, AIChE Symposium Series Num. 326, Vol. 98, ISBN 0-8169-0869-9. Lane Desborough and Thomas Harris, “Performance Assessment Measures for Univariate Feedback Control,” The Canadian Journal of Chemical Engineering, Vol. 70, Dec. 1992. Alireza Haji-Valizadeh, “Optimize Maintenance Resources through Improved Process Diagnostics,” Proceedings of ISA EXPO 2004. Alireza Haji-Valizadeh, “Using Key Process Indicators in Prioritizing Control Loop Maintenance Activities,” Submitted to ISA EXPO 2005. Michael A. Paulonis, John W. Cox, “A practical approach for large-scale controller performance assessment, diagnosis, and improvement,” Journal of Process Control 13 (2003) pp 155-168, ELSEVIER. Biao Huang, Sirish Shah, Lanre Badmus, Anand Vishnubhotla, “Control Loop Performance Assessment: An Enterprise Asset Management Solution,” Philip A. Higgs, Rob Parkin, Mike Jackson, Amin Al-Habaibeh, Farbod Zorriassatine, and Jo Coy, “A Survey on Condition Monitoring Systems In Industry,” Proceedings of ESDA 2004, 7th Biennial ASME Conf. Eng. Sys. Design and Analysis. M. A. A. Shoukat Choudhury, Sirish L. Shah, Nina. F. Thronhill, “Diagnosis of poor control-loop performance using higher-order statistics,” Automatica, Vol. 40, 2004, pp 1419-1728. Paul Studebaker, “See The Light,” Plant Services Magazine, Oct. 2004, pp 36-44. |

