Loop maintenance should be a priority
The first part of this article appeared in the December 2005 issue, page 36, and discussed loop assessment strategies and the automation hierarchy.
An effective predictive maintenance policy uses process diagnostics and performance analysis tools to focus maintenance resources on problematic loops and components that offer the greatest return on investment. Surveys have shown that adopting an effective loop maintenance policy provides considerable improvement in plant operations. One multi-industry loop audit survey reported that only 32% of loops have acceptable or excellent performance.
Many industries now are adopting some form of condition based maintenance (CBM) as a predictive maintenance policy, according to another survey. The objective of predictive maintenance is twofold. First, it aims to address under-performing and problematic loops before they become intolerably faulty, when chances for costly unscheduled shutdowns are high. The second objective is to improve the cost effectiveness of the maintenance effort, which necessitates prioritizing loop maintenance.
Prioritizing loop maintenance on a plant-wide scale is based on various policies, four of which are:
• Loop static priority (LSP) criteria
• Loop fault severity (LFS) criteria
• Contribution to unit fluctuations cost model (UFCM)
• Contribution to pseudo fluctuations cost model (PFCM)
Loop static priorities (LSP)
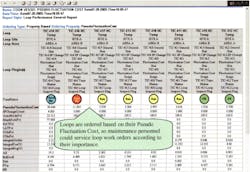
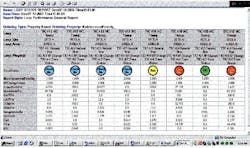
In prioritizing maintenance based on LSP criteria, each loop in the plant is assigned a static priority weight. A loop with a higher LSP is given precedence when there are multiple loops in need of maintenance. The determination of a loop in need of maintenance is based on separate criteria -- excessive values of the average or standard deviation of closed loop setpoint error. The loop static priority is usually assigned by process engineers based on loop criticality. The static priority of a loop is time invariant, but it could be recipe-dependent. LSP also is independent of the loop fault modes. Static loop priorities are usually assigned before attempting any plant-wide maintenance activity. Figure 1 shows the ordering among a number of loops based on LSP, in a report that shows the general tuning status of a number of PID loops.
Loop fault severity (LFS)
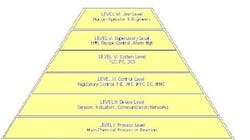
When prioritizing plant-wide loop maintenance based on the severity of fault modes, a loop is viewed as a cut in an automation hierarchy (Figure 2) having the following levels:
• Main process
• Device: Process devices like sensors, actuators, and communication networks
• Control: Regulatory control algorithms such as PID, IMC and MPC
• System: System level automation programs in PLC, DCS and PC
• Supervisory: Supervisory control subsystems such as HMI, recipe management, alarm level, production operators and engineers
These levels are organized according to the logical order of system layers that fall between an operator -- the highest level -- and the underlying process of interest -- the lowest level -- when the operator initiates an action that affects the process.
A number of fault modes have been defined for various levels of the automation hierarchy. By defining appropriate loop assessment indices at each level, we can determine the need for loop maintenance when there’s a considerable deterioration of the loop assessment index.
Many loop problems occur at lower levels in the automation hierarchy. The problems first manifest themselves as a drift and deterioration in performance and assessment indices for the corresponding levels. As problems worsen, symptoms cross borders and diffuse to higher levels, thereby affecting performance indices at the higher levels. Thus, deterioration in an appropriately defined assessment index for a higher level –- for example, the percentage of time a loop is operating in manual mode -– might indicate a severe problem at the lower levels. Evidently, more severe problems provide better opportunity for improvement if the problem is solved. Thus, higher-level assessment indices could be a guide to identifying the problematic loops that might provide a better return on maintenance effort.
An effective strategy that identifies faulty loops needing maintenance provides better economic return on maintenance effort and is based on monitoring the higher-level performance indices before moving down to lower-level performance indices. In other words, among the hundreds of loops a site might have, the maintenance effort should be focused on loops with assessment indices in higher levels of the automation hierarchy that exhibit problems and deficiencies because the faults in these loops are likely to be more severe.
When basing loop maintenance on the LFS method, loop assessment indices are used for both determining whether a loop needs maintenance as well as prioritizing that maintenance.
Unit fluctuation cost model (UFCM)
Measuring maintenance activity effectiveness by means of key indicators has long been standard industry practice. A commonly used indicator is the ratio of unscheduled process shutdowns to the sum of scheduled and unscheduled process shutdowns. An effective maintenance policy should drive this ratio to lower values over time.
Maintenance indictors might include the cost of maintenance in a budgetary period to evaluate maintenance efficiency in addition to effectiveness. Maintenance indicators of this sort, which are designed to provide information to managers, present a few shortcomings when viewed in the framework of predictive maintenance. For example, the above indicator can’t determine if a specific controller for a process needs maintenance. It also can’t prioritize the maintenance effort. Modern predictive maintenance should use the traditional key indictors in conjunction with newly defined methods and measures to render improved maintenance practices.
Cost incurred because of fluctuations in the process variable or control output is a major factor in efficiency loss and a loop’s poor performance. Product quality degradation, loss of energy resources, waste of production, lost production time and shortened lifetimes for process components are side effects of a fluctuating process.
Vendors and academic researchers have suggested many indicators for measuring process fluctuation. Examples include integral absolute error, standard deviation of error, process variability and the like. Current industry practice is to measure and calculate indices of this kind online, preferably using moving-time-windowed analysis for comparison against historical optimum baseline values to determine if the corresponding loop needs maintenance. Incorporating the financial or monetary implications of the fluctuations enhances determining the need and the priority for maintaining a loop.
There are various ways this can be done.
A common approach correlates process fluctuations to quality loss, resource waste, energy waste and production loss and then quantifies the cost of these fluctuations. To this end, we could use material and energy balances, process dynamics, heat transfer and mass flow, physical properties and the like to express the cost of fluctuations in process variables and controller output.
Given the financial model for the unit fluctuations, we could calculate the percentage of contribution of each loop to the total cost of unit fluctuations. By ordering loops based on their contribution to the cost of fluctuations and establishing threshold levels for each loop’s cost, we could determine the priority and the need for loop maintenance. This method offers the following advantages:
• It’s production-unit oriented.
• It provides monetary measure for the underlying production unit’s fluctuations.
• It provides criteria for determining both the need for as well as the priority of maintenance.
• It incorporates different types of controllers (or loops) in the same maintenance scheme.
For example, if the incremental cost of product degradation per unit of process error is known, then one can develop a fluctuation cost model that evaluates integral absolute error (IAE) on a moving window analysis time with length T. Fluctuation cost then could be used as the criteria for prioritizing loop maintenance:
Fluctuation cost = (IAE * incremental cost of product degradation per unit error)/T (Eqn 1)
This method has one disadvantage that could preclude its application on a plant-wide scale. You’ll need to develop a monetary cost model for process fluctuation, that is, determine the value of the incremental cost of product degradation per unit error. This can be an expensive and cumbersome task requiring statistical analysis of process and financial data for the underlying unit.
Pseudo fluctuation cost model (PFCM)
An alternative method that’s rather easily implemented on a large scale is based on only three steps: Developing a PFCM for the controllers, categorizing the loops based on their type and independently prioritizing the maintenance for controllers belonging to each type. As an example, consider the following model that provides a pseudo fluctuation cost per one unit of time:
Pseudo fluctuation cost = (IAE * value of processed product)/T (Eqn 2)
The principle behind this approach is that the cost associated with a poorly-performing controller used in producing a valuable product is likely to be higher, and thus its maintenance should be given precedence.
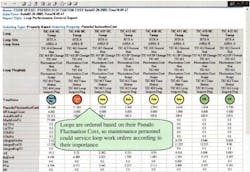
In Equation 2, T denotes the length of time during which the integral absolute error and the value of the processed product are evaluated. The value of T for a batch process could be the batch time and for a continuous process could be four times the dominant time constant. The integral absolute error captures the amount of fluctuation calculated using percent setpoint error and the value of the product processed during interval T. Figure 3 depicts an implementation of this method.
Implementation considerations
Implementing these methods requires calculating loop performance indices such as IAE as well as mathematical formulas for evaluating the fluctuation cost before ordering loops based on their respective fluctuation cost. These steps could be implemented with many generic tools available in the market. There are also industry specific software applications available now that simplify implementation of various methods of loop maintenance prioritization.
Determining if a loop needs maintenance and prioritizing among service-demanding loops are basic steps of any predictive maintenance regime. There are at least four methods for prioritizing loop maintenance (LSP, LFS, UFCM and PFCM). It’s worthwhile to note that these methods aren’t mutually exclusive and different methods could be applied to different loops within the plant.
References
Alireza Haji-Valizadeh, “Optimize Maintenance Resources through Improved Process Diagnostics,” Proceedings of ISA EXPO 2004.
Alireza Haji-Valizadeh, “A new way to look at control loops,” Plant Services Magazine, December 2005.
Alireza Haji-Valizadeh, “Using Key Process Indicators in Prioritizing Control Loop Maintenance Activities,” ISA EXPO 2005.
ControlSoft Inc., “INTUNE V5 Process Diagnostics and Loop Performance Monitoring (PDLPM) Software,” 2004.
Lane Desborough and Randy Miller, “Increasing Customer Value of Industrial Control Performance Monitoring – Honeywell’s Experience”, Proceedings of Sixth International Conference on Chemical Process Control, Jan 2001, AIChE Symposium Series Num 326, Vol. 98, ISBN 0-8169-0869-9.
K. Åström and T. Hägglund, “PID Controllers: Theory, Design, and Tuning,” 2nd Edition, ISA Publications.
Philip A. Higgs, Rob Parkin, Mike Jackson, Amin Al-Habaibeh, Farbod Zorriassatine, and Jo Coy, “A Survey on Condition Monitoring Systems In Industry,” Proceedings of ESDA 2004, 7th Biennial ASME Conf. Eng. Sys. Design and Analysis.
Alireza Haji-Valizadeh is technology development manager and Shahid Parvez is control design engineer at ControlSoft, Cleveland.


