Analyzing lubricant particles helps zero in on root causes
In recent decades, oil analysis laboratories have used automatic particle counters to determine the number and size of particles in many oil-lubricated systems. Once one knows how many and how large, there remains the question of their source. The logical next step is to investigate the particle’s analysis or extract them onto a filter membrane and view them under magnification.
In theory, characterizing particles by shape and elemental composition is useful for determining their source and developing a cost-effective action plan to rectify the mechanical problem that released the particles into the lubricant. However, this approach has two difficulties. First, chemical analysis often is unreliable for identifying larger particles and, second, it’s not possible to make a positive identification of the particle’s elemental composition with optical magnification.
In some cases, scanning electron microscope (SEM) analysis can better characterize the particles, but it’s a time-consuming analysis and it relies on the operator’s judgment about which areas of the sample to investigate.
Technology for sizing and identifying particles eliminates these weaknesses. Many of the better oil analysis laboratories now use an automated electron beam particle analyzer equipped with automated feature analysis (AFA) software to characterize complex matrices of particles extracted onto a membrane filter from oil samples.
Methods
The scanning electron microscope and its automated feature analysis function combine the high magnification capabilities of an electron microscope and the supporting simultaneous energy-dispersive X-ray measurement system with automated searching and recording of data for future reference. The analysis is done in four steps:
- Sample preparation
- Automated data acquisition
- Data analysis and configuration
- Processing the results into a useful report
Getting the sample
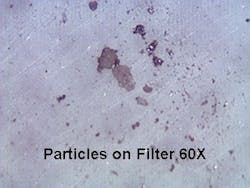
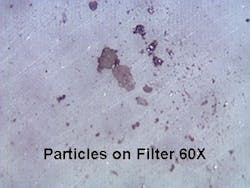
Preparation requires that a representative oil sample be thoroughly homogenized and diluted with a suitable solvent. The analyst will need either to have prior knowledge about the sample or to screen it to determine the best volume to use (usually 1 ml. to 3 ml.) to optimize the capability of the automated functions. Then, the diluted sample is drawn through a low-contrast filter of appropriate pore size, such as an 0.8-micron polycarbonate filter (Figure 1).
Figure 1. Sample prepared on 0.8-micron polycarbonate filter for automated feature analysis (AFA).
Extra care is taken in handling, indexing and storing the filter so that, if desired, the specimen can be reanalyzed at a later date and the same core automated data can be used to search out and further analyze particles.
Getting the data
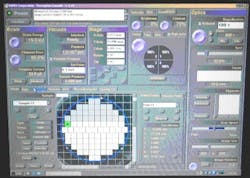
Automated data acquisition exploits the fact that high-energy electrons, called backscatter electrons, scattering off heavier elements tend to have a higher backscatter coefficients than when scattering off lighter elements. Electron microscopes produce an image of an item by detecting contrast in signal intensity between adjacent pixels in a raster image. Unlike a digital camera, SEMs operate sequentially, scanning rows of pixels and stopping at each pixel to acquire its individual signal (Figure 2).
Figure 2. Scanning electron microscope automated feature analysis (SEM/AFA) control screen showing the progress of an analysis on a circular filter.
The intensity of the signal is a function of the item’s atomic number. The analyst adjusts the sensitivity to differentiate the lightest particle to be identified from the background filter membrane.
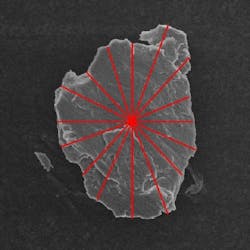
The system automatically and rapidly scans the selected area of the filter and pauses at each particle it detects. During the pause, it shifts to its highest resolution to perform a “rotating chord algorithm” based on 16 straight-line scans across the particle, with scans separated by approximately 11° (Figure 3).
Figure 3. Rotating chord algorithm (RCA) analysis uses 16 chord measurements to determine the size and shape of a particle.
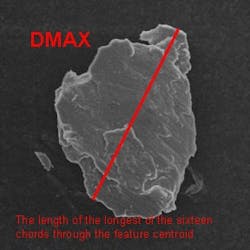
This algorithm yields a wealth of information about the shape and size of each particle (Table 1 and Figure 4).
| Variable | Unit of measure | Description |
|
|
micron | The average length of the 16 chords through the particle’s centroid. |
| Dmax | micron | The length of the longest chord through the feature’s centroid. |
| Dmin | micron | The length of the shortest chord through the feature’s centroid. |
| Dperp | micron | The length of the chord perpendicular to the longest chord. |
| Aspect | ratio | The ratio of Dmax to Dperp |
| Area | square microns | The area of the feature |
| Perimeter | micron | The perimeter of the feature as measured from one chord end to the next. |
| Orientation | degrees | The orientation of the longest chord. Zero is at noon and the angle increases clockwise. |
Figure 4. (clockwise from top left) Dmax is the length of the longest chord through the feature centroid; Dmin is the length of the shortest chord through the feature centroid; Dperp is the length of the chord perpendicular to Dmax; the perimeter is the distance around the particle.
The selective search function can focus on the smallest particles of significance while ignoring smaller ones. The search and measure portion of the automated process is fast, analyzing as many as 33,000 particles per hour, more than nine per second.
The process can be limited to measuring particle morphology and generalized criteria can differentiate the elemental composition of the particles simply by segregating the video signal intensity levels. This method answers general questions about heavier or denser compounds versus lighter ones, but it doesn’t provide a definitive elemental identification.
Combining X-ray spectroscopy with electron imaging yields a huge gain in the quality of the information. The X-ray signal generated by the target particle specifically identifies the particle’s elemental composition, but it takes more time to acquire the data from each particle. Whereas measuring a typical 10-micron round particle can be completed in less than 10 milliseconds, analyzing the same particle using X-ray data collection averages around four seconds. Without X-ray analysis, collecting particle data on a sample having 1,000,000 particles per 100 ml takes approximately 10 minutes. Analyzing the same sample using X-ray data would require more than 11 hours.
Because the X-ray data’s absolute identification of chemical composition is such an important addition to the information quality, a compromise is generally arrived at to correlate a percentage of the sample data to the total. Analyzing 10% of the specimen in a random manner can be completed in about 100 minutes and the data can then be extrapolated to 100%. An additional benefit of slowing down the analysis process is that it can then record an image of every identified particle.
Analyze the data
The analyst is now ready to review and sort the data into classifications that describe the specimen’s dominant characteristics. These classifications can be based on morphology, chemical composition or both. Four interactive software programs view the data, establish classification rules, apply the rules to the data to organize it into an interpretable structure, and view specific particles for more detailed imaging and analysis.
This is the manual portion of the process, with the analyst applying specific knowledge of the specimen and customer requirements to arrive at the most appropriately descriptive and useful results. The better laboratories maintain an extensive knowledge base and the expertise for analyzing a wide range of lubrication products and their applications, and troubleshooting problems arising from lubrication issues. The lab should apply these skills to the analytical process. The rules and structure the analysts apply should be archived so they can be revisited later if you desire revisions to the methodology.
Rules for particle characterization
The rules for case study 1 are shown in Table 2. Scanning the filter determined that the majority of the particles had the elements described in the rule. Tin and iron were most dominant, but other particles and alloys were present. So, this case needed a rule that requested the number and size of particles and the elemental proportions.
| Classification | Rule | % of total |
| Stainless steel | Fe > 30% and Cr > 5% | 1.7 |
| Iron | Fe > 30% | 33.9 |
| Tin | Sn > 30% | 49.0 |
| Silicates | Si > 5% | 1.4 |
| Brass | Cu+Zn+Sn > 35% | 6.6 |
| Sodium | Na > 10% | 2.6 |
| Miscellaneous | Remaining particles | 4.8 |
Build the report
The final step in the process is to take the finished analysis and publish an understandable and useful report. The data is best presented in the form of graphs, tables, electron images and X-ray spectra that represent useful tools for making decisions. Look for reports that can be standardized for ongoing trend analysis and for comparing data from other similar equipment. Portions of the data also should be presented in spreadsheet format so you can insert it in your ongoing data analysis systems. Table 3 shows the sort of analysis performance you should seek.
| Particle detection efficiency | Greater than 99% |
| Particle sizing precision | 0.25 microns or better |
| Particle sizing accuracy | 0.50 microns or better |
| Occurrence of false positives | Less than 1 per mm2 |
| Sizing rate | about 33,000 particles per hour |
| Characterization rate | about 1,800 particles per hour |
Case study 2: Gear box
Location: Coal-fired power station
[b]Description of sample:[b] Gear oil from pulverizer gear box
[b]Sample preparation:[b] 20 ml of thoroughly mixed oil was diluted with heptane and drawn through a 0.45-micron nitrocellulose filter, followed by a thorough rinsing with heptane.
[b]Analysis parameters:[b] 100% of the exposed filter area was searched to find particles of 4 micron and larger using 15-keV beam energy, vacuum and a backscatter element detector.
[b]Summary of findings:[b] A total of 2,083 particles in eight elemental composition categories were identified on the filter (Table 5).
Mining the data
Table 6 shows only the key findings for a typical analysis. With 285 particles counted in 41 different categories of particle characteristics, there is far too much data to present it all here,. However, this table illustrates that the analyst can sort by variables of interest. In this case, the data is sorted on Dmax (descending). It’s clear the particles are:
a. Slightly oblong or rectangular (average aspect value around 2).
b. The particles are primarily iron and silicates.
c. The average size is 85 micron.
[b]Summary of results:[b] This analysis showed that gear wear was caused by three-body abrasion from contaminating silicates.
The SEM/AFA analysis for size and elemental composition is superior to conventional particle analysis methods. The method described can save you dollars and needless speculation.
William R. Herguth is president and Guy Nadeau is senior SEM/EDS analyst at Herguth Laboratories, Inc., Vallejo, Calif. They can be contacted at (800) 645-5227.
