An algorithm for establishing rational quantities of spare parts and production materials
“The storeroom never has the parts we need.” This statement has been voiced by many throughout our plant. During an operations meeting, management emphasized that something must be done to stop the extended breakdown times resulting from material shortages that cause lost production and revenues. The storeroom manager quickly responded by taking the lead to improve customer service from stores.
The storeroom manager began her venture by reviewing the shortages that occurred during the past six months. Her summarized findings revealed that 20% of these occurrences had inaccurate, on-hand inventory records that, if correct, would have fulfilled the requirements. The other 80% had accurately recorded, on-hand inventory but not enough quantity to satisfy the requirements. The manager decided that she should focus first on the factors causing 80% of the problem, but inventory inaccuracy would need to be tackled immediately following.
What is inventory optimization?
[pullquote]Realizing the complexity of righting the inventory quantities to satisfy internal customers while ensuring that costs are managed, the storeroom manager decided to learn about the subject and attended an inventory optimization workshop.
Inventory optimization is an ongoing structured approach to ensure inventory is stocked in the proper quantities to support operations without carrying excess inventory. Management assigns the acceptable service levels required from stores for each class of materials. Inventory analysis then determines the appropriate reorder point and reorder quantities required to sustain those service levels.
Inventory optimization benefits
Getting inventory under control provides valuable advantages. These include:
- Minimal inventory — quantities are set at the lowest point that supports operations
- Less obsolescence — only the required inventory is carried
- Reduced expediting — the inventory held most requests
- Satisfied customers — stock is based on anticipated needs
- Increased inventory turns — the right materials are held at the minimum acceptable quantities
- Reduced idle time waiting for materials — the needed items are available immediately from stock
- Reduced loss of revenue — production is operational more often.
Inventory optimization
At the workshop, the storeroom manager learned how to calculate the savings to be achieved by inventory optimization. The steps are as follows:
1. Confirm that lead times to order, purchase and receive materials are accurate. This ensures that replenishment occurs when expected.
2. Calculate the costs associated with carrying and ordering stock items (Table 1). The Association for Operations Management (APICS) defines carrying cost as “the cost of holding inventory, usually defined as a percentage of the dollar value of inventory per unit of time (generally one year). Carrying cost depends mainly on the cost of capital invested, as well as such costs of maintaining the inventory as taxes and insurance, obsolescence, spoilage and space occupied. Such costs vary from 10-to-35% annually, depending on type of industry. Carrying cost is ultimately a policy variable reflecting the opportunity cost of alternative uses for funds invested in inventory.”
Table 1. Basic carrying cost determinatio
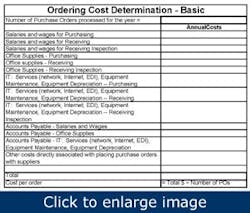
APICS defines ordering cost as “used in calculating order quantities, the costs that increase as the number of orders placed increases. It includes costs related to the clerical work of preparing, releasing, monitoring and receiving orders, the physical handling of goods, inspections and setup costs, as applicable (Table 2).”
Table 2. Basic ordering cost determination
3. Assign service-level expectations by material classification. Critical materials might require 99% fill rate. Non-critical materials might be set to 90% fill rate. You could use a 75% fill rate for easily acquired materials such as those items that might be purchased in local retail establishments when you fall short of requirements.
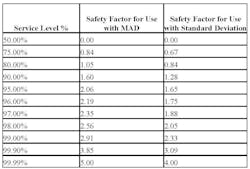
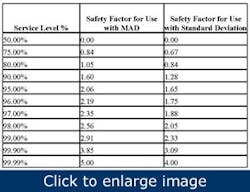
4. Choose the statistical equivalent for calculating safety stock based on approved service level (Table 3).
Table 3. Service level
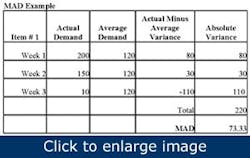
5. Calculate the safety stock levels for each inventory item. Record the quantity issued in each of the past 52 weeks and calculate the average weekly usage based on these 52 weeks. Record each week’s absolute deviation from the weekly average and then square those values. Add the squared absolute deviations and calculate the average of the total squared absolute deviations. Next, calculate the square root of the average of the total squared absolute deviations. Using the mean absolute deviation (MAD) safety factor from Table 3, multiply the relevant safety factor for each material by the calculated square root of the average total absolute deviations. This is your safety stock quantity, which might need to be rounded upward to match inventory unit of measure (Table 4).
Table 4. MAD Example
Service levels
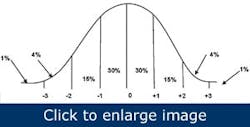
Service level is a measure, usually expressed as a percentage, of satisfying demand through inventory, when requested. For example, if we want to be certain that four out of five times an item will be in inventory when required, then we would require at least an 80% service level (4/5 = 0.8). The service factor is a statistical measure (safety factor) associated with the percentage service level and used to calculate the safety stock for each item. For optimization, we use MAD, the sum of absolute deviations from calculating weekly usage — average weekly usage and then dividing that total by the number of observations.
The normal distribution curve is described by two characteristics. One relates to its central tendency, or average (the 0 line), and the other to the variance, or dispersion, of the actual values above and below the average.
The safety factor is the numerical value based on the forecasted standard deviation or MAD to provide a given level of customer service. For example, if the item’s MAD is 100 and a 95% customer service level (safety factor 2.06 from Table 3) is desired, then a safety stock of 206 units (100 X 2.06) should be carried as safety stock.
Because MAD is always smaller than standard deviation, by about 1.25 times, the multiple of the safety factor with MAD must be greater to be equivalent. The table of safety factors already reflects this adjustment.
6. The reorder point is simply the demand expected during lead-time plus safety stock.
7. Reorder quantity typically refers to the economic order quantity (EOQ), which provides the lowest total cost of carrying and ordering materials for stock. The formula for calculating the EOQ is:
Where:
- A = annual usage (units)
- S = ordering cost (dollars)
- I = annual inventory carrying cost (decimal)
- C = unit cost (dollars)
By means of a numerical example, consider an item, of which you use 1,000 units per year (A), and it costs $20 to place an order (S). The annual inventory carrying cost is 20% (i = 0.2) and each item costs $5. In this case:
8. Calculate the savings or costs incurred to right the inventory levels.
- The carrying cost financial effect from optimization is equal to: (New reorder point + New reorder quantity – Current reorder point - Current reorder quantity) x (Inventory unit value x Carrying cost percent).
- The ordering cost financial effect from optimization is equal to: ((Total usage / New reorder quantity) – (Total usage / Current number of orders)) x Cost per order.
- The total financial effect from optimization is equal to: Carry cost financial effect from optimization + Order cost financial effect from optimization.
9. Recommended reductions to inventory require review by the internal customers to ensure that other factors aren’t dictating the higher-than-optimal inventory level. Other departments such as purchasing should review the recommendations to confirm there aren’t other factors, such as scarcity of supply, in play. Increases to inventory require approval from management.
The storeroom manager developed an electronic spreadsheet with the various formulas to calculate the changes and savings. Prioritizing based on criticality and financial benefit realized financial savings almost immediately. The manager achieved her goal to satisfy the internal customer while controlling the costs associated with carrying and ordering inventory.
Sandy Cater is materials management consultant at ABB Reliability Services in Toronto, Ontario. Contact her at [email protected] and (289) 259-5067.
