Use a structured approach to select the appropriate level of effort for your root cause analyses
There are literally hundreds of business processes in the reliability and maintenance toolkit. Many of these might produce business inefficiencies, potentially increasing costs or adding time and energy burdens to everyone involved in reliability. Money-saving projects might be delayed; failures go unresolved; and spare parts aren’t on bills of materials or aren’t ordered in time.
Companies review business processes regularly when there are major business changes, such as upgrading or changing enterprise asset management (EAM) systems. Too often, the review is only to determine if the revised or new EAM can accommodate the current business processes. While this is critical to the success of any EAM implementation, it doesn’t guarantee that the current business processes are the most efficient or take full advantage of the EAM.
Consider these definitions:
- Business processes — the interconnected systems by which a company performs standard tasks
- Business process map — a diagram that shows the steps and alternative paths through the business process, indicates the overall functional roles and responsibilities, and defines decision points
- As-is map — the chart depicting the current state of the business process
- To-be map — the chart depicting the defined future state of the business process being mapped
Business process mapping
Figure 1. Business process analysis
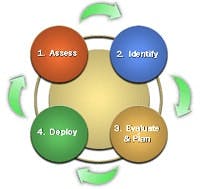
In addition to ensuring business processes meet the need of the EAM and vice versa, business process mapping should be one of the “evergreen” tools used for continuous improvement (Figure 1). Evergreen refers to a practice that continues over time to ensure that the intended results are always current. This often refers to annual process reviews, such as PM task optimization. The purpose of the mapping is to:
- Identify the current practices, roles and responsibilities
- Define the desired, future practices, roles and responsibilities
- Identify the obstacles to implementing the future state
- Develop an implementation plan to achieve the future state
The most critical tool for business process mapping and improving business processes is the people assigned to the analysis team. The team needs to represent every organizational function that uses the current process.
Figure 2: General Process
There usually are policy and procedure documents available that define the process being studied. There might also be flow charts that give a pictorial view of the process and any connections to other business processes. Requisitions have an approval process, followed by a purchasing process, followed by receiving. Parallel to these processes are invoice receipt and approval and then disbursement. The business process team needs to have its charter defined, and it’s likely that there will be many teams over time to address all connections.
Business process method
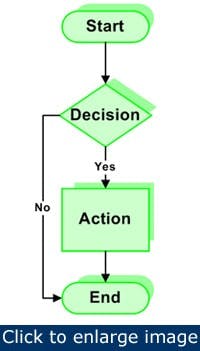
Every business process has a defined start and a defined end (oval blocks). In the most simple case, there are no interconnections to other processes.
Figure 2 shows an analysis of a one-step business process. The process starts; a decision (diamond block) is needed. The positive decision (Yes) results in an action (rectangle) while the negative (No) decision ends the process.
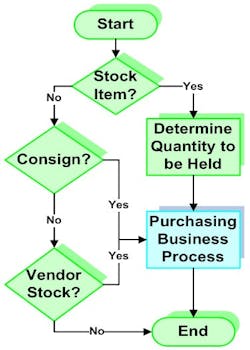
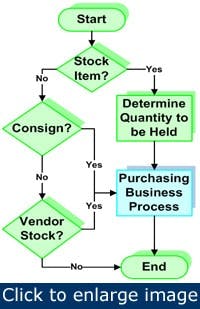
The reality looks more like Figure 3. Note the purchasing business process is not defined in this map. Determining the number of items to be held in inventory is a separate analysis involving a number of factors (lead time, cost, criticality).
Where to start
Figure 3: Expanded process
Once the team is assembled and chartered, the first step is to define the process in its current state. This is the as-is process map. If this is a completely new process, however, the first step is to define the endpoint of the process: what do you want to achieve?
It’s tempting to skip the as-is step. After all, “everyone” knows how the process works. This would be true, except that everone knows how it works from their own perspectives. Part of the as-is process mapping is to review several things:
- Is the endpoint of the current process defined?
- What other business processes are related to the process being analyzed?
- Are there roles and responsibilities defined in the policies and procedures related to the process?
- Is it possible to define the transaction costs of the current process?
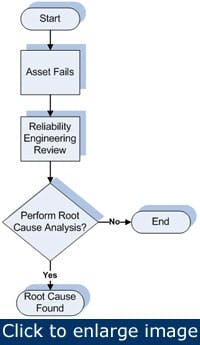
Figure 4 is an as-is business process for selecting asset failures to be analyzed to find their root causes. Note that finding the root cause is an endpoint in this example.
How well does this process map answer the questions? There are endpoints defined. End and Root Cause Found and no other business processes are noted. The only roles and responsibilities shown are for the reliability engineering organization (decision block). A recent decision not to perform a root cause analysis (RCA) has cost $500,000 in repairs and production downtime for a second failure.
Continuing the analysis
Figure 4: As-is process map. It’s based on the answers to the questions and there are a number of possible enhancements to the business process flow that should be considered.
The to-be analysis has the potential:
- To change the root cause analysis decision
- To clarify or add to the roles and responsibilities
- To modify the endpoints
The expensive failure has changed the game. Plant management has now determined that a more rigorous approach to the decision making regarding performing an RCA is needed. The items to be considered by the to-be analysis team included:
- Increase reliability engineering staff to perform RCA on all asset failures
- Cross-train members of the plant community to lead/support root cause analyses
- Choose the asset failures to be analyzed based on relative risk, cost and failure rate or other variable
- Use a tier of analyses based on failure cost
- Maximize use of the EAM software to manage reliability incidents
- Clarify the roles and responsibilities for RCA
The analysis team concluded that hiring a sufficient number of reliability engineers and supporting staff to lead the RCA process wasn’t feasible financially. They recommended the cross-training option.
The next factor addressed was the core of the problem: Which asset failures should be analyzed and on what basis should the decisions be made? The answer to this question is industry- and plant-specific.
At a soup manufacturer, any downtime greater than a specified number of hours was considered unacceptable. An asset failure leading to this excessive downtime always received a root cause analysis. For paper manufacturing, paper machine downtime usually dominates cost considerations for root cause analyses. However, asset failures in the recovery area might also lead to paper machine downtime. The analysis team recommended that the plant determine the relative risk of asset failures based on several criteria:
- Safety
- Environmental
- Running time
- Manufacturing impact (lost production)
- Quality
- Maintenance cost
- Failure rate
Relative risk then would be one of the driving factors for choosing to perform the RCA. The business process map for relative risk ranking was the subject of a separate analysis after the recommendation was accepted. The EAM the plant used has dedicated fields that include relative risk. The relative risk data were uploaded after the risk ranking was completed.
The team also looked at the level of detail needed for root cause analyses. Sometimes, an individual can perform the analysis. Other events need a team. The plant determined that initially a cost breakdown would be used to set the threshold for analyses:
- Less than $10,000
- $10,000-$100,000
- More than $100,000
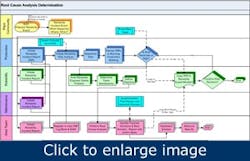
Because this could lead to the exact result that set the process mapping in motion, the team added a review of the decision. To ensure that the roles and responsibilities were clearly defined, the business process team chose to show the cross functional relationships between the positions. Figure 5 is the to-be business process flow.
Defining the as-is before defining the to-be identifies the possible pitfalls of the change as well as the attributes that must be retained. For the RCA example chosen, the full benefit depends on the results of implementing the changes to protect the asset. However, well-defined roles and responsibilities, as well as a formal process, increase process efficiency. This reduces time and energy expended.
Figure 5: An example of a cross-functional flow chart. Note that symbols indicate information flow to or from the primary chart. The symbols in the cyan color identify a predetermined process.
Other examples, such as defining flow charts for materials management processes, have the potential to reduce transaction costs, inventory carrying costs and delays in delivering parts to the field. Today, the need for efficiency fully supports reliability.
William D. Conner, III, CMRP, P.E., is a senior project manager for ABB Reliability Services North America. He can be reached at [email protected] and (713) 876-9269.
