|
PdM and CMMS Read Ed Espinosa’s previous article about PdM and CMMS implementation at Puget Sound Energy at http://www.plantservices.com/articles/2013/08-why-pdm-programs-fail/. |
It’s been a number of years since the selection and implementation of your CMMS has occurred. You’ve spent an enormous amount of time creating templates for various CMMS modules and then populating them with decades’ worth of what now seems to be insignificant legacy data. You’ve spent months populating these, and now it’s time to scrub them for errors. Your scrub template finds the expected errors that you overlooked. These must be repaired before proceeding. You spend even more time than anticipated correcting these before submitting these templates to your company’s EAM support group for back-end CMMS loading into a sandbox environment.
You and your team have worked very hard to achieve this milestone in your company’s MRO development. So now you have a functioning CMMS. You attend a tradeshow to benchmark how your company is doing compared to others to see where you can improve your process by increasing efficiencies, reliability, and availability, and, at the same time, reducing costs. You listen to a presentation detailing the tenets of reliability-centered maintenance (RCM). You take what you’ve learned to your leadership, and the decision is made to perform a RCM implementation. A living RCM program would most certainly be beneficial in achieving the goals identified earlier during your benchmarking exercise.
Much like the decision to implement a CMMS, the one to implement a living RCM program is equally enormous and resource-intensive for many months, and possibly years to come. Integrating the results of this study in the CMMS again is labor-intensive and demands heart-borne dedication for the benefits to be realized. Initial results are mixed and may be too early to judge if the RCM project delivered the results promised.
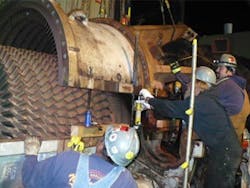
Figure 1. Your MRO team needs to standardize how they execute maintenance across your facilities.
In an attempt to better ascertain the results of an expensive RCM implementation, management decides your MRO team needs to standardize how they execute maintenance across your facilities (Figure 1). This need translates itself into another project from corporate, and, as all projects go, this one is no different in manpower requirements to implement it fully. Your management team decides that some sort of standardized maintenance management system or work management process is long overdue since it’s difficult to measure results with scattered, unconnected data. And, if results cannot be measured, then they can’t be managed, and, if they can’t be managed, then by the same reasoning, long-awaited improvements to your process can’t be realized. And if your process doesn’t improve, all the work and money that has been invested into your organization yields questionable returns, at best. This scenario is not a wise use of your company’s resources thus far. So, what needs to happen next?
Next, the consultants arrive on-site and yet another project begins, a long tedious and painful journey that takes time away from your real job, the work of running an effective MRO team or, at least, that is what you’d like for them to be considered. You have endless meetings to go to. Some of these are to discuss project milestones, others to discuss budgets and timelines, and yet others to discuss lessons-learned. All of this takes time, time spent to find out you are behind schedule in rolling out this work improvement project, and of course you and your team find yourselves behind in the real work that matters, the work that keeps your operation functioning and keeps the lights on.
When the consultants leave your company a year from now, the new work process is clunky at first but, with time, your crew gets the hang of it. Your KPIs are published for the first time and it clearly shows there’s plenty of room for improvement. So another journey begins to improve your process. The benefit of KPIs points to areas of where to improve, a process to be done incrementally. And, again, like most anything worth striving for, process improvement will take time.
The next level in the maintenance continuum for many facilities in this situation is achieving a state of mind where failures are not merely anticipated and contingencies measures kept in hot standby, but rather eliminating failures by eliminating the causes of failures. The next logical question is what are the causes of failure? To answer that, we need to look at the failures themselves to provide a hint in order to arrive at an answer.
So where does one find failures? One finds failures documented within your CMMS. They are found in your CMMS assuming you and your team are following work management philosophy of identifying and documenting work, work not already embedded in your CMMS as preventive maintenance — designed to generate into orders on a given frequency, but work stemming from observed materiel deficiencies or corrective work.
Corrective work or what some folks like to refer as reactive work, since as a maintainer of equipment, you are reacting to a situation, is identified by three means. As plant readings are being performed, the reading taker is trained to look, listen, and feel. The maintainer is trained to use senses to detect the minutest changes in perceived conditions such as the sound rotating machinery makes or the temperature of a motor as detected by the back of the hand or the sound of the slop in belts rotating on a pulley. This method may seem primitive, but it certainly captures the pulse of the process.
Another way to identify corrective work is through inspection. The work management system recently implemented should have a means set aside for doing this. Sections of the plant are divided into periodic inspection routes designed for the sole purpose of looking for and finding materiel discrepancies. These discrepancies are then documented in the CMMS and, if agreed to by the MRO staff, acted upon to restore equipment to new or like-new status.
And finally, the next means of identifying corrective work is by the execution of preventive maintenance. During planned inspections, either invasive or indirect, material discrepancies are uncovered that initially were not apparent to a process variable reading taker or conventional system walk-down external inspection. An example of PM inspection uncovering corrective work is predictive maintenance. PdM has the ability to find the incipient problems otherwise known as functional failures in many cases long before catastrophic failures occur.
So, how is documented corrective maintenance within the CMMS corralled together to extract meaningful information as a basis to take pointed action to reduce failure and increase reliability per RCFA? The functionality to capitalizing on this aspect lies within your CMMS. Modern CMMS software has the functionality to analyze failure. This process involves the use of performance measurements dependent on operator input partly and standard system timestamp features started upon initial CMMS documentation.
A work request notification is entered into the CMMS. To successfully save this record, the CMMS has required fields that need to be populated such as equipment number, functional location, and possibly work priority. The CMMS has several more fields that may not be required for record saving but need to be populated nonetheless for proper failure analysis. Failure analysis is data-driven. More data is good. More data that is accurate is optimum. Your CMMS may have anywhere between a few and a dozen related failure analysis fields to populate. Closely review these fields and understand the information they provide and decide if you need these populated or not.
Failure analysis is tied to equipment records representing operating assets in your facility. A key failure analysis field related to the asset is object type. The object type feeds the object part field in the work request notification. When rolling out the CMMS implementation, the functional location/equipment template used to back-end-build the hierarchy will have a field that, when populated, satisfies the object part data requirement. The object part consists of a series of characters identifying what type of equipment it is. The character string should have information identifying pump, or valve, or fan, or gear, for example.
The ways that equipment fail are represented by codes that are preloaded within the applicable CMMS module during the implementation and are listed in a dynamic value list for the end user to select when assigning a type of damage to equipment failure. Not all equipment is subjected to the same damage that causes them to fail a certain way. There may be overlap but not always, so it is best that each object part have a subset of damage codes assigned. When populating the damage code portion of the upload template, make sure you use a wide-range, robust set of damages. This list can be found in most MRO textbooks.
Once the corrective order is complete and “actuals” are being recorded, make sure to enter what the solution was to correct the damage and restore the equipment. This is the remedy to the problem. Recording this bit of information may come in handy in future failures because the track record would exist on what was done in the past to correct the problem. It may be discovered that the older remedy to the problem may have introduced a defect into the process that ultimately led to another failure, which means that another remedy needs to be developed and implemented. The only way to know for certain is to take the extra time and record the data in the CMMS. This information may hold the key to which actions must be taken to reduce downtime from several days to only several hours.
Lots of accurate data accumulated over the years is optimum. Now combine this with analytical functionality such as mean time between failure (MTBF) and mean time to repair (MTTR) via malfunction start and malfunction end commonly found in CMMS, and you’ve got a toolset that provides a path for equipment reliability improvement. You improve reliability by minimizing or eliminating the causes of failures altogether. If you eliminate the cause of failure, you essentially eliminate failure. And that is measureable, quantifiable improvement. Again, the elements that make this analysis possible with such rewarding results is defining an object type (what category of equipment), damage code (what is wrong with it that prevents it from operating), cause code (what is the culprit that triggered the damage), and remedy code (what was done to repair the damage and restore the equipment).
The other piece of the RCFA functionality toolset that would help immensely in cutting to the chase is the Pareto chart. The Pareto principle states that 80% of your problems are caused by 20% of your equipment in an industrial setting. A Pareto chart displays the data in such a way as to make it obvious what the biggest problem is.
An example of how to apply a Pareto chart to your MRO application is finding which equipment has the highest occurrence of failure, which has the second most failure occurrence, and so on. It ranks equipment failure occurrence from highest to least, from left to right. You now know what the most troublesome equipment is.
With this information, you can now concentrate scarce resources on the most troublesome equipment to garner the most maintenance bang for the buck. Further analysis can tell you what damage said equipment sustains and, taking it a bit further, what the causes of that damage are.
It focuses your effort to obtain the highest return with minimal expenditure. That is a quick win in anybody’s book.
Remember when tediously populating those cumbersome data templates and thinking these have no value for your future use of CMMS, think again. The data on these templates may very well hold the key to future process improvements through an even and steady improvement of equipment reliability.
