By Bob Rice
Spoiler alert: PIDs interact and that interaction makes root-cause analysis difficult.
Process interaction presents a major challenge to those who are responsible for correcting issues linked to PID controller performance. For the sake of perspective, recall that the average production facility uses hundreds of PID control loops to maintain safe, efficient operation. In the best situations, the behavior of those PIDs can be described as variable. It may be no surprise that few practitioners experience “the best of situations.”
For all of the difficulty presented by interaction, there is a silver lining for practitioners. First, techniques exist for both analyzing process data and characterizing the relationship that exists between and among a production facility’s PIDs. Secondly, technologies can perform that analysis nearly instantaneously on a comprehensive unit- or plantwide basis.
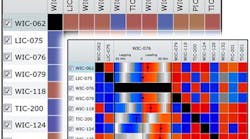
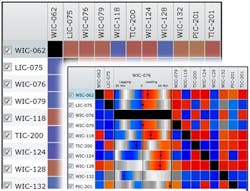
Figure 1 - Technologies like CLPM solutions automate Cross Correlation calculations and color code the Lead-Lag relationship that exists between control loops. Some technologies specify the timing of those relationships, making root-cause analysis even simpler.
Cross-correlation analysis has been proved to establish the lead-lag relationship that exists between different PID control loops. For clarity’s sake, “lead” suggests that a given PID operates upstream of another in the flow of a process. In contrast, “lag” characterizes a control loop that operates downstream from another control loop. Here are some specifics about cross-correlation that are worth considering:
- Cross Correlation involves a mathematical assessment of the behavior or patterns showcased by different PID control loops. The signal data from one loop is shifted both positively and negatively relative to the signal data of a second loop, and an value of correlation is calculated. PIDs that have identical patterns and that move in synch would produce a value of either one (1.0) or negative one (-1.0). As may be expected, most values fall in between these two extremes. Note that a value of zero (0.0) indicates that no relationship exists between the two loops. While the calculation isn’t exactly simple, cross-correlation does provide a single numeric value, which can make things easier on the assessment side. That leads to the second point of this post.
- An array of readily available process diagnostic and optimization tools automate cross-correlation computations. This is most relevant for plants that have a large number of PIDs. In smaller facilities with a limited number of PIDs, the relationship between control loops is generally linear and/or limited in scope. Simply moving upstream from one loop to the next can ultimately uncover the root cause. However, in larger facilities, the relationships and the computations are more complex. Larger PID counts typically correspond with production processes that involve recirculation loops, which obscure the relationship between PIDs, and the amount of computation required can be overwhelming. For sure, automation can be a good thing. Now on to the last point – a question.
- Who cares about downstream loops? Snarky though the question may be, there is a practical issue to consider. If the goal is to isolate the root cause of a performance issue, then it would be logical to focus exclusively on those PID control loops that are located upstream. Any evidence of a downstream relationship as provided by cross-correlation is simply an echo of something amiss upstream, and it brings you no closer to the root cause. With the help of automated cross-correlation calculations, practitioners can quickly identify the suspects located upstream and speed the time to resolution. That sure beats spending time with complex calculations that ultimately point to a downstream dead end.
It’s true: Loop interaction makes root-cause analysis difficult. And although correlation doesn’t mean causation, advanced forensic methods such as cross-correlation can help practitioners make sense of loop interaction and get a jump on root-cause analysis. If your facility has a large number of PID control loops, then a control-loop performance monitoring (CLPM) solution or other automated technology could be helpful in eliminating the analysis complexity and speeding up the analysis. As with most things, time is money!
For more on this topic, see the following:
Advanced Forensics for Limiting Suspects and Isolating Root-Causes
How Does Loop Monitoring Help with Root-Cause Analysis?

