Most practitioners have horror stories that can be linked directly to bad data. In my experience, bad data often is the primary contributor to poor control and even poorer analysis. Indeed, bad data is routinely the reason why performance issues go unnoticed for extended periods of time and productions assets fail seemingly out of the blue. While the decreasing cost of sensing, storage, and analytical technologies has been a key factor in the improvement of both process data and plant performance, the primary reason behind the steady surge in those technologies is that the value of avoiding performance issues and asset failures is simply so high.
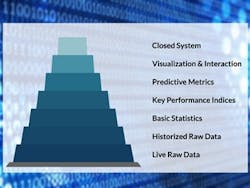
In “Purgatorio,” 14th-century poet Dante Alighieri writes about the different levels of Purgatory – the theological equivalent of "no man’s land" that exists between heaven and hell. The situation improves for the book’s protagonist as he moves from level to level. In a similar fashion, the situation for process manufacturers improves as they advance in their commitment to both capturing and leveraging good process data. With Dante as inspiration, here’s a take on the seven levels of data use:
Level 1: Live raw data
At this most basic level, data points stream through in nonstop fashion with no storage for future analysis. Only current or short-term data is visibly available on the operator HMI screens. More often than not, decisions related to performance issues are based on what’s visible on an operator's screen or what the operator remembered happened sometime in the past. Sadly, this is the reality for some organizations – albeit fewer and fewer – in today’s manufacturing realm.
Be sure not to blink as you might miss something important.
Level 2: Live and historic raw data
While more data may be collected at this level, the benefit of additional insight isn’t guaranteed. Here, data is captured and stored in some form of database. Often, it includes data from multiple sources and is stored in multiple unconnected data silos. Unfortunately, it's all too common that the data’s collection speed is slow because of database constraints, and collecting data from multiple sources doesn’t always mean collecting data from the right sources. At this level, true analysis for the purpose of improving safety and performance remains stymied.
While not particularly helpful, this can satisfy a plant’s basic regulatory requirements.
Level 3: Basic statistics
Think of this level in terms of rudimentary statistics such as average, median, and mean. With these calculations, data is finally being processed in a manner that provides a basic level of context and insight. As examples, it allows engineers to determine if a given control loop is exhibiting more than typical error or if a valve is operating outside its normal range and possibly near a physical constraint. It’s a start, but this level still leaves much to be desired.
This still forces plant staff to operate in reactive mode as the insights remain limited.
Level 4: Key performance indices
At this level, data finally begins to shape, and it equips staff with much-needed awareness of changes in a plant’s current performance. The use of KPIs – whether those that focus on productivity or others that assess the health of PID loops and assets – provides important reference points for prescribing corrective actions. Equally important, those KPIs enable staff to shift away from a strictly reactive or scheduled approach to maintenance and to perform PMs on a more proactive basis as the situation demands.
The majority of manufacturers operate at this level and use data to avoid nonstop firefighting.
Level 5: Predictive metrics
When data makes the transition to predictive as at this level, staff are finally positioned to optimize production performance and avoid costly unplanned downtime. The prognostic nature of predictive metrics allows staff to capitalize on how a plant’s processes and assets performed in the past. These metrics help staff anticipate negative trends and adapt accordingly.
Innovation is making the shift from preventive to predictive possible for a growing number of manufacturers.
Level 6: Visualization and interaction
Beyond predictive metrics and the related analytics is a more-interactive level of data that involves visualization. As most practitioners might attest, predictive data analytic solutions are generally unintuitive – the findings are somewhat abstract and difficult to interpret. With the help of visualization and augmented reality tools, however, the data becomes more consumable by the average plant staffer. Performance routinely improves when more staff are able to capitalize on the available data and analysis.
It’s here that AI and augmented reality look to affect the future of manufacturing automation.
Level 7: Closed-system
When data reaches this final level, most production staff are relieved of their responsibility for supervising performance. In their place, the plant performs analysis and determines the necessary corrective actions in a closed-loop fashion. As the overseer of day-to-day business processes, the closed system assigns work orders to the appropriate plant staff in coordination with the plant’s production schedule.
At the zenith of automation this level ironically represents hell as practitioners are finally pushed aside.
Most practitioners appreciate that data access and use have changed dramatically since the first digital manufacturing systems were introduced. What’s more, the rate of progress continues to accelerate across all sectors of the manufacturing industry as innovation makes data easier to access and technologies make data easier to understand. With most of us operating between levels 4 and 5, it feels as though we’re in our own state of Purgatory. Just ask Dante: Misery loves company!
If you’re interested in developments in the use of data to improve process performance and reliability, then consider these related posts:

