Analyzing plant data for operational improvements and sustainable operations

While most manufacturers collect process data from sensors throughout their plants, engineers sometimes have difficulty understanding it. However, the data contains clues about a variety of operational improvements that can lead to achieving business sustainability objectives.
Improving those objectives remains a major industrial focus as global, national, and regional environmental regulations continue to strengthen. Analyzing time-series data leads to greater sustainability. Sensor-generated information residing in databases, also known as historians, can be extracted and analyzed for deeper insight into process behavior over time.
By analyzing the data, process experts can take proactive and prescriptive measures for operational improvements that lead to sustainable outcomes. These improvements may include reducing energy consumption, improving water and wastewater quality, and cutting carbon emissions.
Closing the communication gap
Traditional approaches to data analysis are complex and time-consuming. Data scientists did most of the analysis prior to the advent of Industry 4.0 and the Industrial Internet of Things (IIoT). But engineers and data scientists do not speak the same language. This created a communication gap because engineers often had to explain their processes to data scientists so they could crunch numbers.
Today, advanced data analytics software allows process experts to evaluate time-series data themselves without the help of a data scientist. It gives engineers who know their processes best the analytical power to make data-driven decisions. As the software gains greater adoption, industries find that the technology helps them reduce costs and remain profitable. The advanced analytics solution offers process experts opportunities to contribute directly to a company’s profitability and sustainability objectives.
Specific industry challenges can be solved
Industrial processes generate an abundance of time-series data. The data in historians tells a story about the processes, how they interact, and what outside factors might influence their performance. It also can tell process experts why an anomaly occurred, and when it likely will happen again.
Advanced data analytics adds significant benefits to existing digital infrastructure. These advanced technology solutions are designed to help process experts reduce equipment downtime by helping them discover the root cause of an issue so they can take quick action. Solutions should include the ability to alert personnel about changes in process behavior and extraction efficiency. Engineers also gain crucial information about the performance and reliability of equipment and can schedule timely maintenance. Companies see prolonged asset health and life and improved OEE.
Advanced analytics offers plant managers the essential engineering support and holistic, 24-hour approach to running and managing their operations. Additionally, the solutions interpret time-series and contextual data. Information on raw materials, operational events, and maintenance schedules may reside in third-party applications. These systems create data silos when they are not connected.
Third-party integration lets engineers review the contextual data next to the time-series data. Putting the data into context gives process experts a deeper insight into their operations without having to track down reports in separate files maintained by separate teams and departments.
Although environmental regulations all aim for the same sustainability goal, regulatory guidelines affect process operations in different ways. Advanced analytics solutions offer advantages to multiple industries. For example:
- Comparing an undesirable batch and an ideal batch can help the chemical industry identify batch deviations.
- Deploying the technology helps the food and beverage industry improve product quality and decrease costs.
- Ensuring wastewater exiting a mine is free of forbidden effluents can provide advantages to the mining and metallurgy industry.
- Evaluating water, wastewater, and energy management offers benefits to the oil and gas industry for both upstream and downstream production.
The following examples demonstrate the value of advanced data analytics solutions.
Yield optimization of a spray dryer
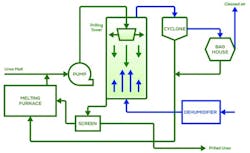
This plant produces solid particles in a prill tower, as seen in Figure 1. During this process, the product is sprayed from the top of the tower and solidifies while falling. The plant’s goal was to produce as many particles as possible that meet required specifications. The final particle size and distribution depends on several factors, and the company discards suboptimal particles.
On average, 25% of the product was not meeting particle size requirements. Engineers wanted to reduce the number of particles they were throwing away. They had theories about how certain factors influenced the final particle yield, such as temperature and feed. Yet, they had trouble testing and proving those theories using conventional methods.
The team was able to calculate yield quickly by applying the advanced data analytics solution. Team members then could test their hypothesis.
The product goes to a solids packaging system and is bagged immediately after it is sprayed from the prill tower and solidifies. There is no flow measurement. Instead, the bags are placed on a scale and weighted while filling. Engineers first had to create a calculation to get the average yield. They did this by using the ratio between the number of particles with the correct particle size vs. the total number of particles released. Next, using the data analytics solution’s search capabilities and layer comparison tool, engineers detected and identified periods with a high or low average yield.
The first hypothesis was that the temperature in the spray dryer influenced the yield. Using the calculation to get the correct temperature, they then searched the software for periods with a constant flow for at least five hours. The results were then sorted based on their minimum and maximum top temperatures. Engineers could see that for periods with a lower temperature, the average yield was between 6% and 16% higher.
To quantify the relationship, engineers used the data to create a scatterplot. The trendline showed that for an approximately 1-degree Fahrenheit temperature difference, the yield could be improved by 1% for a given constant flow.
After the previous test, engineers took a similar approach to investigate the effect of the temperature of the feed flow. The hypothesis was that product with a higher temperature could freeze quicker under certain conditions.
Engineers calculated a weighted average first because the feed comes from two separate tanks. The results of the analysis found that nitrogen, temperature, and total feed was the same for periods with lower and higher feed temperatures. No significant effect on the yield could be seen for this period.
By using an array of functions in the advanced data analytics solution, engineers finally were able to identify the cause of decreased spray dryer yield. Cooler temperatures resulted in a higher yield. This new knowledge corresponded to an estimated $4 million in business value.
Waste reduction for ammonia process
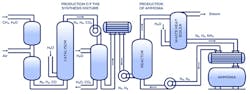
Removing carbon dioxide from the product stream is one of the first steps in the ammonia production process. It is important to remove as much carbon dioxide as possible because it is a significant factor in the inactivation of the catalyst. The plant removes the product in a striper or washing unit using a dedicated washing liquid, as shown in Figure 2. The plant was experiencing frequent carbon dioxide peaks because the carbon dioxide was not being washed out properly. These peaks were unexpected after washing because the unit is designed to remove CO2, but the team lacked a solution for a deeper investigation.
However, by using an advanced data analytics solution, process experts set out to identify when the problem started. In the software, they performed a value-based search to identify timeframes where the carbon dioxide concentration peaked. The results immediately indicated that the carbon dioxide peaks were more present starting in May 2014 than in the months and years before.
Engineers then used data analytics to compare the periods before May 2014 (good operation) and after May 2014 (bad operation). When searching for the periods where carbon dioxide peaks appeared, the software indicated numerically and visually that more peaks occurred after the installation of the packed washing column in May 2014. Therefore, they also compared the period before the packed column was installed with the period after.
The numerical comparison showed that the washing fluid flow toward the column was higher because of lower pressure before the methanator and after the new column was installed.
Engineers gained two new insights:
- The carbon dioxide peaks are not highly affected by the temperature of the process gas, but rather by the limited quantity of supplied washing fluid.
- Accordingly, the steam consumption needed to supply the heat to the process gas could be reduced in practice. The engineers concluded that by lowering the pressure before the methanator, it likely would decrease the amount of carbon dioxide peaks and lead to a more stable operation.
As a result, the plant discovered that steam consumption could be decreased by about 165 tons per day. Also, because the operation was more stable, the daily ammonia production could increase by 50 tons. The corresponding business value is $2.1 million/year.
Empowering manufacturers
Companies today are faced with several challenges that are relatively new to industries. They include not only having to function during and after a global pandemic, but also adhering to changing environmental regulations.
IIoT, digitalization, and advanced analytics have empowered manufacturers to leverage their time-series and contextual data to meet these new challenges while improving operational performance and helping to meet sustainability objectives. Simultaneously, these solutions help to reduce costs and increase the bottom line.
Industries that embrace IIoT and advanced analytics have a bright journey ahead.
This story originally appeared in the August 2022 issue of Plant Services. Subscribe to Plant Services here.
Wouter Daniels has worked for TrendMiner as a data analytics engineer for the past three years. He helps train and advise companies to get the most out of their stored time-series process data and uses customer feedback to help improve the advanced data analytics software. Wouter also provides custom solutions for more complex cases. He earned his Ph.D. in chemical engineering at the University of Leuven, where he studied data analysis and modeling of biochemical systems with the goal of increasing bioproduct yields.