2020 PdM survey results: Program satisfaction remains high despite budgetary obstacles

What a difference a few weeks can make.
When the 2020 Plant Services PdM-RxM Survey launched in early February, strong measures had already been introduced in China to help control the spread of COVID-19, but industry in the United States had just begun to be impacted. By March 11, the World Health Organization had officially characterized the coronavirus outbreak as a pandemic, and various lockdown and shelter-in-place measures were rolling out across the United States. By the end of March, when the PdM survey period ended, the virus had already destroyed $23 trillion in global market value.
Now, in mid-April, various sectors of the world economy are at a standstill. The U.S. Department of Labor is reporting that 16.8 million workers have filed unemployment claims, putting the unemployment rate at 14.7%. More than 316 million people in at least 42 states, three counties, nine cities, the District of Columbia and Puerto Rico are being urged to stay home.
At a time when manufacturers are improvising to overcome supply chain challenges, staggering their worker shifts, banning visitors, and installing space and barriers between workers to protect them from infection, the status of the plant’s proactive maintenance program might be the last thing on anyone’s mind. Certainly, fewer respondents were able to set time aside this year to take the survey than in previous years.
The good news is that the portrait of PdM in 2020 that is emerging is one where (a) respondents are still increasingly satisfied with their programs; (b) respondents are increasingly comfortable with partnering outside the organization as needed to maintain program strength; and (c) the only significant obstacle to success is perceived to be the budget.
L.P. Hartley coined the famous phrase, “The past is a foreign country: they do things differently there.” Let’s take a look at what industry thought of their proactive maintenance programs, right as the COVID-19 iceberg was striking the U.S. manufacturing economy.
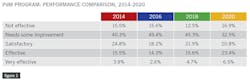
1. Are you satisfied with your PdM program?
This year’s survey results story starts with probably the key KPI: are you satisfied with your PdM program? We are excited to report that, for the first time since we started this survey in 2014, a majority of respondents expressed satisfaction or better. From a low of 35.1% in 2016 to this year’s high of 50.7%, program satisfaction has trended steadily upwards (see Figure 1).
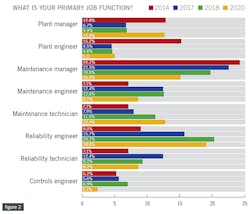
Several demographic questions such as job title, size of maintenance and reliability staff, and annual revenue usually help put this KPI into context, and you can obtain those data by downloading the full set of 2020 survey data at https://plnt.sv/2020-PDM-RXM. Included here are two of those charts, which mostly suggest that the industry demographics measured by this survey have not changed much since 2018.
On Figure 2, the job title chart, you’ll note that the general percentage of types of job titles has stayed stable since 2018, suggesting that for the moment, the race to add full-time reliability positions is slowing. The number of maintenance manager respondents continues its six-year trend downwards, even as the number of plant managers who responded jumped considerably this year.
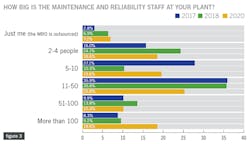
And Figure 3 indicates that the number respondents who work in very large maintenance teams has nearly doubled from two years ago. The long-standing pattern of teams with 11 or more employees still holds steady at about ~55%, and plant teams of 10 and under holding at ~45%.
2. What does your PdM program look like?
If Figure 1 is our traditional key KPI, then Figure 4 is the baseline index of what types of predictive maintenance technology people report they are using. This year, the four technologies that have been at the top of our survey for the past several years (vibration, infrared, ultrasound, and oil analysis) are joined by a fifth: electrical motor testing, which has earned steady support in this survey since 2014.
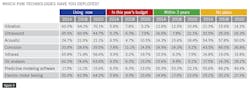
Just as telling as the numbers of people who report they are using these technologies are the those who report they have no plans whatsoever to use them. All five technologies earned a “No Plans” score under 30%, meaning that at least 70% respondents have plans now or in the future to use then; and oil analysis, IR thermography, and vibration each earned “No Plans” scores of under 20%.
Figure 5 is a companion question which asks about the type of assets managed by your PdM solutions. It usually maps well onto the data from Figure 4, and is a useful chart for teams who like to know how their program compares to others in industry. This year’s results hold few surprises. For example, in Figure 4, 70.1% of respondents said they use vibration analysis, and in Figure 5, 70.3% of respondents say they are using PdM to manage production assets like pumps and other rotational equipment.
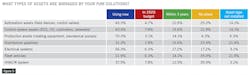
Again, it’s interesting to note that at least 75% of respondents have plans to use PdM technologies on most types of plant assets, with only fleet vehicles and HVAC/R systems not earning that score (they still earned nearly 65%).
3. Overcoming program obstacles
The next area of the survey asked about both obstacles to PdM program success as well as possible solutions to overcome those problems.
Figure 6 indicates that uncertainty about success is rising slightly overall, and is rising sharply in a few areas. The strongest area of concern is budget constraints: in the past two years, the number of respondents who consider budget their top obstacle increased by more than 25%. And while respondents feel more confident about how to define the financial benefits of PdM, the number of respondents who consider this a top obstacle increased by more than 32%.
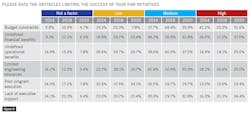
Clearly, respondents feel challenged by the budgets they are given, as well as capturing and/or communicating the payback that PdM programs can deliver. It’s also worth noting that lack of executive support has been steadily increasing as an area of high concern since 2014.
Given the pressure that COVID-19 has placed on many facilities to develop remote or work-from-home options, the data in Figures 7 and 8 may be the most important of this year’s survey. In Figure 7, the number of respondents who are using OEM-enabled remote monitoring technologies and/or services is up to 38.3%, and the number of those with no plans to do so is down to 43.3%. There isn’t much of a middle ground left: those who want to engage with these service teams are not waiting to have those conversations.

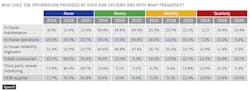
Also, the data-sharing trends of the past several years continue in the same direction, with Figure 8 showing some interesting increases in sharing data remotely on a monthly basis with teams outside the organization.
4. What are you doing with your PdM data, and where are you storing it?
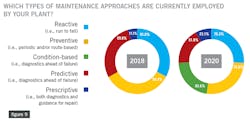
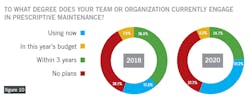
This article concludes with several charts that show the types of proactive (and reactive) maintenance that respondents are engaged with, as well as how they are collecting their data. Figures 9 and 10 indicate an increased readiness for programs that push the proactive envelope by engaging in prescriptive maintenance (i.e., RxM, or outcome-based maintenance). Figure 10 again shows the willingness of respondents to actively explore the benefits of prescriptive programs, as nearly 13% of respondents have moved from having “future plans” for RxM to “using now.”
Finally, Figures 11 and 12 identify the types of tools being used to collect PdM data and then store and/or process it, respectively. There has been an explosion of devices and apps that can be used to collect predictive data and, as Figure 11 shows, plant teams are using all of them, with an especially large jump in the number of people using wireless sensors.
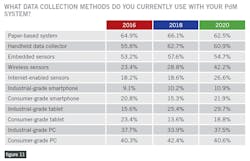
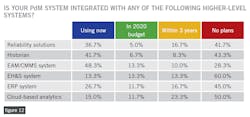
Figure 12 indicates a clear preference for CMMS systems and data historians as systems that can support PdM data storage and analysis. Except for CMMS, a surprising number of respondents have no plans to integrate these data with higher-level systems, suggesting that respondents are not yet convinced of the value or benefit. Given the business disruption from COVID-19, it will be interesting to see whether these attitudes change.
About the Author

Thomas Wilk
editor in chief
Thomas Wilk joined Plant Services as editor in chief in 2014. Previously, Wilk was content strategist / mobile media manager at Panduit. Prior to Panduit, Tom was lead editor for Battelle Memorial Institute's Environmental Restoration team, and taught business and technical writing at Ohio State University for eight years. Tom holds a BA from the University of Illinois and an MA from Ohio State University