The P-F curve and the path to capacity assurance
In their pioneering 1970s research to determine the most effective approach to maintenance, engineers Stanley Nowlan and Howard Heap created the P-F curve. Their focus at the time was to help United Airlines and the U.S. Defense Department proactively cut losses and downtime for aircraft.
The P-F curve has been widely applied throughout manufacturing ever since, although interpretations of it have evolved, and its original purpose and intent are sometimes misconstrued. Many variations of the P-F curve have been produced and publicized; some of these are not accurate and others send mixed messages.
However, four decades later, the fundamentals behind the original P-F curve remain and offer important lessons in how maintenance should be performed.
Combined with the data-directed insights that we have available today, we can swap out time-based maintenance for condition-based maintenance. The P-F curve helps companies continuously improve their asset capacity assurance for years to come.
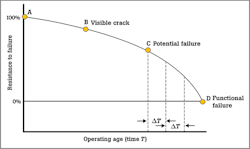
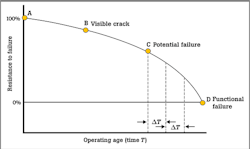
The P-F curve is a way of representing an asset’s behavior or condition before a potential failure and progressing toward a functional failure.
Back to the basics
Nowlan and Heap discovered that organizations’ traditional approach at the time — using nothing but typical preventive maintenance — was simply not the most efficient or cost-effective way to manage equipment. So, they developed a rigorous engineering process to identify ways to drive down costs, increase uptime, and prioritize maintenance activities.
Let’s review their original P-F curve. This is how they defined the terms used with their original curve:
Point P = potential failure: An identifiable physical condition that indicates functional failure is imminent.
Point F = functional failure: The inability for an item (or the equipment containing it) to meet a specified performance standard.
P-F interval: The time it takes for an item to functionally fail once a potential failure has been detected.
Problems in interpretation
However, for many organizations over the years, Point P has become the focus when it comes to efforts to improve asset reliability. The problem is that Point P is too late. The failure mode that caused Point P has already occurred.
The question we need to ask ourselves is why Point P occurs in the first place.
A great number of people also still believe that Point F is an absolute failure. An asset experiencing functional failure still runs, but it cannot achieve the desired performance level.
That has left people often asking, “How do we really know what the P-F interval is?”
Let’s review:
The curve was developed to help drive good maintenance practices.
Point P is NOT where the asset failure occurs (the failure mode has already begun).
Point F is NOT where the asset has totally failed but where it has functionally failed (it is still running).
Back to why the P-F curve is still important. Here are three important reasons:
- It helps illustrate how maintenance should be performed and improves the fundamental understanding of this
- It spells out how we decide to maintain an asset or run it to failure
- It makes clear the business case for on-condition maintenance — predictive maintenance (PdM), condition-based maintenance (CBM), and corrective maintenance
Introducing capacity assurance
Capacity assurance maintenance (CAPM), also known as “maintainability,” addresses where corrective maintenance activities exist within the P-F curve. When teams apply CAPM, they ensure the highest attainable level of inherent reliability of an asset or system.
Capacity assurance (CAPA) considers the entire continuum of reliability-based maintenance — from design, implementation, and commissioning to precision or corrective maintenance aspects.
Here is how they look as part of the P-F curve:
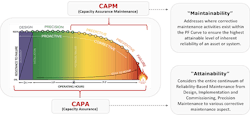
The P-F curve, representing the life of an asset, is elongated when condition-based maintenance replaces time-based maintenance.
The D-I-P-F interval and how to align your maintenance strategy
The diagram below illustrates the D-I-P-F interval, created by Doug Plucknette, president of Reliability Solutions Inc. and founder of the RCM Blitz®. Plucknette refers to the D-I-P-F interval as a continuation of the P-F curve.
D-I-P-F stands for “design, installation, potential failure, and failure.” These represent the phases in the asset lifecycle:
Design: The point where a team is selected to procure capital and design the asset to a desired level of reliability
Installation: The point where the equipment is installed and put into service
Potential failure: The point at which a defect is first detected via condition-based maintenance
Functional failure: The point at which the asset can no longer deliver its intended function
The intent of the D-I-P-F interval is to show where maintenance tools and techniques have the most impact on reliability. With condition-based maintenance and the data-directed insights it provides, teams can elongate asset life well before a potential failure. In other words, an asset can perform at a higher level for longer.
Technology is the differentiator today, but is not the only component needed for a successful maintenance strategy.

People are still essential to analyzing data and driving processes using advanced maintenance technologies available today.
Components of a successful maintenance strategy: P-P-T
This brings us to the three most important parts of a successful maintenance strategy:
- People
- Processes
- Technology
People: Defining clear roles and responsibilities as well as corporate terminology helps improve value-based decision-making and determine front-line ownership of equipment and process, all fostering a culture of reliability.
Processes: Integrated processes and workflows, as well as aligned KPIs and metrics and internal and external benchmarking, help improve asset lifecycle management.
Technology: The ability to easily access integrated or linked data, systems, and asset documentation via technology is vital to ensuring that assets stay up and running.
Gregory Perry, CMRP, CRL, has nearly two decades of experience in maintenance and operational best practices. He is a senior maintenance reliability consultant with Fluke Accelix. In addition to delivering implementation and consultative services to clients, Perry also presents maintenance best-practice sessions at leading industry conferences and has developed several online best-practice webinars.
Technology alone will not do. Without people and processes, you will not be able to effectively prioritize and act.
Step change needed for Industry 4.0
To move past reactive strategies and manual data entry, organizations need connected reliability — a framework to connect data, systems, and teams. Through continuous improvement, people adapt to new processes and technologies, ensuring that capacity is both attainable and maintainable.
When properly adopted, connected reliability affords teams a customizable way to take the first steps toward a more capacity assurance-focused reality.