Get better insights from your vibration data

Machinery impacting contributes significantly to rotating machinery failures and process interruptions. To determine which machines are experiencing impacting, maintenance managers traditionally send technicians on scheduled routes to gather machinery vibration data. Experts then analyze the data, and managers make decisions to act based on the resulting analyses.
Extracting insights from vibration data requires a clear understanding of spectral analysis and recognizing frequencies and patterns. That’s why trained experts are often called in. This article gives a general idea about the types of analyses that must be performed to uncover rotating-machinery issues. The key for most maintenance managers is to understand the signs well enough to make correct decisions and avoid machinery shutdowns.
Collecting the data

Figure 1. The data-collection chain — comprised of the sensor, sensor cable, and a portable analyzer or continuous monitor — is the source of route-collection data.
Ensuring proper analysis of machinery or asset conditions begins in the field with data collection. The sensor is the beginning of the data-collection chain (see Figure 1), which also includes the sensor cable and the device into which the sensor is collecting data – a portable analyzer or continuous monitor. Proper sensor selection, placement, and mounting onto the machine to be monitored is critical to having valid data for analysis.Configuration of the data channel is also critical. One must be aware of the data expected to be captured. Accordingly, the person configuring the data channel should set parameters such as maximum frequency, lines of resolution, and number of samples (if averaging). If these first steps are not planned well enough, there is a risk that the collected data will not be ideal for asset analysis.
When using a portable analyzer, alarm limits and other notifications are often available as a part of the route definition loaded in the analyzer from the software. This allows the data collector in the field to identify any measurement points that may have exceeded the set alarm limit. Evaluating asset condition while still standing near the asset in the field is ideal. Less-than-ideal is noting the potential anomaly after returning to the office and then making an extra trip back to the field for additional data collection and possibly other data parameters, such as phase.
Some portable analyzers offer embedded expert analysis tools that allow even the less experienced analyst to achieve masterful results while collecting data. If someone else plans to analyze the data, then the collector technician can note the preliminary field analysis to provide the analyst with in-field observations and opinions from the data collector.
Traditional data analysis
After the route data is gathered, analysis begins. The focus is on the assets identified, either via alarmed points or notes taken in the field, to have exceptions. Basic vibration analysis relies heavily on waveform and spectral analysis using pattern recognition.
Waveform plots are drawn from the raw analog data gathered during the collection process and are a great tool to identify impacting in the asset. These waveform plots often represent amplitude versus time.
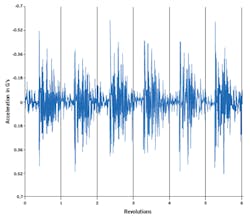
Figure 2. Waveform plots are drawn from the raw analog data gathered during the collection process and are a great tool to identify impacting in the asset.
The impacts that are shown in the waveform in Figure 2 are not alarming due to amplitude, but concern is caused by the repetitive pattern of the impact as it occurs once per revolution. In this plot, the time axis has been converted from time to shaft revolutions. This data was collected on a reduction gear and the impacting is indicative of a cracked or broken tooth.
Spectral plots are the conversion of the waveform into a plot representing frequency and amplitude. This conversion is accomplished using the fast Fourier transform (FFT), a mathematical process that identifies the frequency and amplitude content in the waveform (a very simplified explanation of the FFT process). These plots are typically easier to interpret because the analyst is generally looking for frequency content.
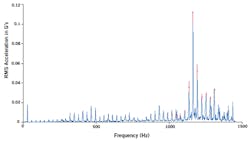
Figure 3. This spectrum is a textbook example of a cracked or broken tooth when two gears are meshing together.
The spectrum shown in Figure 3 is a result of the FFT process on the waveform of the broken or cracked tooth. The primary cursor on the larger peak marks the gear mesh frequency at 40 times the rotational speed of the shaft. The secondary-peak cursors are marking sideband cursors that are spaced at one-time the rotational speed of the shaft. These indicators make up a textbook example of a cracked or broken tooth when two gears are meshing together.
One issue with this typical analytical process is that some frequencies may overwhelm the range of the analyzer, thus masking, or hiding, the frequencies that indicate other defects. When these frequencies are hidden, identification of issues might come in the late stages of failure. Notice that the spectral data shown in Figure 3 are displayed in units of acceleration. It is common for spectral data to be displayed using units of velocity, but in this case the acceleration data shows the high-frequency impacting much better. From a reliability perspective, the goal is to identify these potential issues as early as possible to allow for repair preparation and possibly the shifting of the operational schedule.
Diagnostic methods help interpret the data
To interpret the data, experts traditionally have looked for patterns or fault frequencies. For example, some patterns such as the gear mesh pattern previously shown indicate gear issues.
To find balance and alignment issues, experts might look at phase analysis. When the machine is operating, its components should move as one, or in phase. When the movement is not phase locked, impacts occur, and machinery issues arise. Phase analysis requires a tachometer input to provide the phase correlation between the high-vibration data and the reference mark on the shaft.
Analytical processes that allow the filtering of low-frequency mechanical vibration combined with a high sampling rate can focus on high-frequency impacting events – events that can indicate bearing- or gear-related issues. Focusing on these frequency ranges allows the system to capture the true peak amplitudes of these impacting events, providing severity evaluation along with spectral and waveform patterns. These true peak amplitudes are repeatable and trendable over time, providing an early warning of developing faults so proper planning and prioritization of corrective actions can take place to avoid an unplanned outage.
A level of severity can be determined as well as the likelihood of machinery problems by considering the amplitude of high-frequency machinery impacts. The amplitude of high-frequency impacts from bearing or gear defects indicate when the issues require more attention. For example, random impacting at a high speed could indicate a lubrication problem or potential pump cavitation.
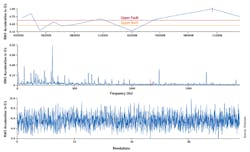
Figure 4. Correlation of waveform information reveals details.
In Figure 4, the consistency of the overall value trend along with the associated spectral and waveform data for the high vibration datapoint show important information. Performing a correlation of the waveform shows that the impacting is more associated with a repetitive impacting event and not cavitation or lubrication.
Conclusion
Brian Overton is sales development and training manager at Emerson.
Whether using manual calculations and analysis or guided by embedded intelligence in handheld tools, the analysis done via regular machinery monitoring routes provides invaluable knowledge to avoid slowdowns or unexpected shutdowns.
About the Author
Brian Overton
Emerson
Brian Overton is the senior customer enablement manager and SME for machinery health products for Emerson. Having been with the organization for over 30 years, Mr. Overton’s background has been broad and vast, covering all aspects of reliability maintenance. Prior to his tenure with Emerson, he proudly served in the US Navy as a nuclear-trained electrician where his foundational knowledge of reliability maintenance was established.