Fix your preventive maintenance strategy
A great number of variables influence the development of a preventive maintenance strategy. What industry does this pertain to? Is there an asset library for all of the assets that the strategy will affect? Is the asset hierarchy set up correctly in the CMMS? Has a thorough criticality analysis been completed? Have RCM and FMEA been completed on these assets? Is there data to help determine frequencies? Is a work management system in place? Are any PdM technologies being utilized at this site? Is there a need for FDA compliance and other regulatory compliances? Other variables, such as culture, capital, business decision-making and leadership factors, have important effects on the development and ultimate outcomes of a PM strategy, as well.
There are many ways to get things done in this industry. Often, a facility’s practices are so terrible that solving a few problems within the facility leads to some sort of improvement. Whatever way is tried works in that moment. There are many “good” ways to do things, but the ultimate question is what is the “best” way to do them. I believe this is where the difficulty comes in. Many organizations think that their “good” way is the “best” way, but what works in one industry or market segment can completely fail in another. So, determining the “best” way to create and execute something such as a PM strategy can be difficult. For one to have a winning combination, all site-specific variables as well as key characteristics of the industry need to be understood.
There will be many similarities between industries, but there is not one recipe that works for all. Following is an outline of what I believe is necessary for developing an effective PM strategy.
Criticality analysis
Start with a criticality analysis, if you haven’t done one already, to identify which cells, components, or pieces of equipment need the most attention. If done correctly, this will help you pinpoint which equipment will need a PM strategy (or multiple strategies) and which will not. I have seen time and time again organizations trying to PM everything they own. This leads to multiple problems. First, we do not have enough staff to do PMs on everything. Second, this takes attention away from the assets that need more attention. Third, it ends up wasting a lot of the budget. For example, an exhaust fan in the warehouse that has no overall consequence to the business should be allowed to run to failure. That means that no time or money should be spent maintaining it. Why would we waste our time there? Yet it’s not uncommon to see PMs in the system for such an asset to check the v-belts, lubricate it, etc. Without a criticality analysis, an organization can’t determine whether a given asset needs maintenance.
Two items have created this “PM everything” problem:
- Many maintenance mechanics believe that it is their job to do maintenance, and therefore everything needs maintenance. This is a training and awareness issue, not a PM issue.
- When something does break, no matter the consequence, the tendency for management is to overcome this by adding a PM into the system. A criticality analysis can be used to help beat this tendency. If a criticality analysis was completed with a cross-functional team and had the leadership team involved, all of the justification needed to not add a PM would be to state that the asset was determined not to be critical and therefore the best strategy was to run it to failure. Why add non-value-added work?
Which approach to use?
Once the criticality analysis is complete, you need to determine which assets will use which approach for asset ranking. For example, your “A”-ranked, or most critical assets, will use RCM or FMEA to understand the failure modes associated with these assets. Your “B”-ranked, or middle percentage of assets, will use FMEA to understand the failure modes associated with these assets. Lastly, the “C”-ranked, or bottom percentage of assets, will either see their PMs optimized and linked to failure modes their PMs eliminated altogether.
[pullquote]
The end goal is a failure-mode-driven strategy on critical assets, with different maintenance vehicles used to achieve the greatest reliability that makes the most business sense while possibly trimming or eliminating PMs on less-critical assets.
Task development
Once these items have been completed, move on to the development of maintenance tasks to convert into PMs. Most of these tasks will have already been developed through the RCM on your critical assets, and depending on how the FMEA was completed, tasks could be identified there as well. They are normally split into three categories:
Failure-finding tasks: interval-based tasks, such as redundant equipment checks, or emergency system checks that are designed to detect failures that may have occurred but are not known. The goal is to expose hidden failures within the system. For example, a fire-system pump that would need to be used only during an emergency needs to be checked periodical for functionality to ensure that it will work when it is called upon.
Planned-maintenance tasks: interval-based tasks, such as replacements, rebuilds, or overhauls, that require a hard stop to complete the task regardless of condition. These are normally performed at intervals based on hours, miles, or calendar time.
On-condition tasks: interval-based tasks, such as inspections or tests, designed to detect a potential failure based on its condition and allow for its correction before it becomes a functional failure. When defining the task, be specific with as much detail as possible. Also, if applicable, make sure there is a specific measurement or standard to measure the “check” against. For example, instead of entering “check the chain,” the direction could be: “Check chain elongation with a chain wear gauge. 0%-1% is good; for 1%-2%, write a follow-up work order to replace the chain; for 2%+, replace the chain immediately.”
PM types
Once the tasks are determined, the PM types should be separated into buckets. These are the buckets into which I like to separate them: lubrication, calibration, inspection, adjustment, testing, replacements, and rebuild/overhaul. There may be more that work for other facilities, but these are the basics.
Why do I separate them into buckets? Many PMs you see today have a combination of these types mixed into a single PM. You’ll see something like: “check the chain, lube the bearing, calibrate the scale, and test the e-stops,” with the PM’s frequency specified as weekly. I separate the tasks for two reasons:
- The frequency is not appropriate for each task. For example, in most applications, the bearing does not need to be lubricated every week, nor does the scale need weekly calibration. I can break up the larger PM into smaller tasks, requiring less downtime, and extend the some of the task frequencies.
- I am wasting labor and materials on unnecessary work. I can eliminate non-value-added work from my PMs and get more value-added work done with the resources I have.
PM frequency
Determining PM frequency can have complications. The theoretical answer is always simpler than the actual one. The best answer is that you have to use your experience and common sense supported by some sort of set standard, criteria or decision tree, but here is a theoretical answer.
Understanding and use of the P-F curve, and understanding failures
Failures can be defined as follows:
With a potential failure, a system or equipment is operating correctly within given parameters but has a detectable failure. For example, it could be a pump bearing that reveals through ultrasound or vibration monitoring the beginnings signs of spalling. The pump is still operating within its parameters, but the failure has been detected.
A functional failure is a failure that causes the system or equipment to not meet its intended function. For example, a pump with the parameters of pumping 40 gallons per minute consistently is now pumping 39 gallons per minute consistently. This pump is not meeting its intended function but has not broken down.
In a catastrophic failure, the asset no longer functions.
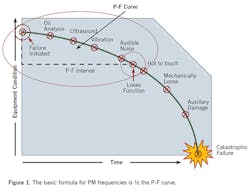
Knowing this, we can begin to understand the P-F curve (see Figure 1). The basic formula for PM frequencies is ½ the PF curve: It is the difference in time between the potential failure and functional failure divided by two. For example, a pump runs from the time the failure is detected to when it has been functionally failing for 28 days. This would mean that the PM frequencies for this pump would be 28 days/2, or 14 days.

If you are doing PdM routes and have data, this would be a great method to use. The problem with this method is the many variables that go into determining the frequency of needed maintenance. The biggest one for me is, “What if the failure was never detected or detected very late?” This could change your frequency rather dramatically.
Another great solution is to go with duty cycle, number of units produced, run hours, etc., to create your frequencies. This is probably the best route to go if at all possible.
Time estimates
Once the PMs seem to be in order, it is time to assign estimated times to them. Time estimates on PMs are overexaggerated because different PM types get mixed together and mechanics wind up doing PMs to change parts instead of completing a series of assigned tasks and writing follow-up work orders to correct identified defects. To avoid this problem, following are recommended practices for developing more-accurate PM time estimates:
- Do a time study of different mechanics completing the PM task list. The study should be completed with a very experienced mechanic and a new mechanic.
- Take the average time between the two to come up with the estimate.
- Get feedback from all mechanics as to how long the tasks take
- Do not forget to add time for safety and quality compliance, clean up time, travel time, security restrictions, etc.
- Add up these times and develop the estimate
Initiate new PMs
Now it is time to initiate the new PM strategy. Assign the work and go. Do not wait to achieve perfection. In the end, all that really matters is that you start somewhere and continuously improve. The goal of having a strategy is to execute for improvement with the goal of extending asset life. Tailored approaches may be needed according to the specifics of the industry, organization, or plant. For example, one facility might take one asset and focus all it can on making that one asset have the most-effective strategy possible, while another may have the capital and resources to do a full-scale implementation. Execute upon the work and monitor progress. Over time, PMs can continuously be improved through mechanic feedback, introductions of new technologies, or a shift in business needs.