2018 electrical safety survey results: Is your plant a safe plant? Part 1

Plant Services readers have regularly weighed in on two key research topics – predictive maintenance programs and workforce issues. Your responses have shed additional light on actions and attitudes that are going on in real time on your plant floor. For 2018, the Plant Services editors wanted to add a third research project into the mix, and the choice of topic was an easy one to make: electrical safety. No other topic is as key to plant best practices as safety or as important to team morale. And in terms of electrical safety specifically, few other plant hazards are as sudden or as invisible as electrical risks, especially arc flash. In fact, close to one-quarter of survey respondents said that they had been involved in an arc flash event, and 60% reported knowing someone who has been involved in such an event.
Future follow-up surveys will help reveal electrical safety trends over time; for now, the data provide an insightful and current snapshot of electrical safety in the places where you spend a large chunk of your time.

Here’s hoping your plant is a safe plant.
Background / up to code
This year’s electrical safety survey is designed as a benchmark study, with questions balanced across electrical incidents, safety gear and technology, training and certifications, and an analysis of the most common obstacles to achieving a safety-first, safety-always culture.
The survey was open from Oct.-Dec. 2017 and attracted nearly 200 responses from Plant Services readers. Figure 1 illustrate the types of jobs that survey respondents hold, and Figures 2 and 3 show their levels of electrical expertise and the types of industry certifications they hold, respectively. Other questions asked where you fit generationally (about half of respondents are Boomers and older, and half are Gen X and Millennial); the size of your maintenance/reliability team (about half were between 5-50 people); and the number of plants your organization manages (close to 70% of respondents work for organizations of five plants or fewer).
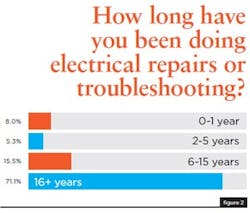
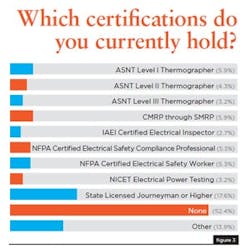
One number in particular jumped out: 71% of respondents have at least 16 years of experience doing electrical repairs and troubleshooting. This year’s survey respondents are clearly an experienced bunch – a trend that extends to professional certifications as well: Nearly half of survey respondents have earned at least one professional certification.
There also was one question on the survey designed to uncover your overall perception of electrical safety at your facility: Do you consider your plant electrically up to code? As Figure 4 indicates, 25% of respondents replied “no”; that share that did not vary significantly across any of the demographic groups – job title, vertical, generational, plant / team size, experience or certification level – identified in the initial survey questions.
This number maps interestingly onto two other survey questions. The first of these asked about your facility’s average time between electrical incidents. As Figure 5 shows, 25% of respondents said the average time between incidents at their plant was six months or less, and again the data did not vary significantly across demographic categories.
The second question asked about whether your facility engages in near-miss reporting, and 72% reported having a formal near-miss reporting program in place. The other 28% indicated that either an informal program exists (18%) or no program is currently in place (10%).
Technology
This year’s survey asked six specific questions on the types of electrical safety technology that are currently in use at your facility; these data are available in the full downloadable report (http://plnt.sv/1802-ES). Some of the data highlights include the following.

Safety Technologies. The most commonly deployed safety technologies reported by respondents are limit (93%) and interlock (91%) switches, followed by single-function relays (93%), motor control devices (90%), PLCs and drives (87%), overcurrent protection devices (86%), and proximity devices such as light curtains (84%).
In fact, the only technology option listed in this question being used by less than 70% of survey respondents is IR windows/viewports: only 37% of respondents are currently using them, and 49% report they have no plans to do so in the future.
Personal Protective Equipment. When asked what types of PPE are available for use, respondents cited safety glasses (97%) and safety shoes (96%) the most, followed by insulating gloves (87%), leather protector gloves (86%), face shields (86%), and hard hats (85%). The least-available types of equipment all fell into the category of insulating equipment: insulating sleeves (55%); insulating live-line tools (i.e., hotsticks, switchsticks, shotgun sticks, 54%); and IPE such as line hoses, rubber hoods, and rubber blankets (50%). Also, about 40% of respondents indicated that there were no plans in place to make these types of insulating equipment available to employees.
{pb}
IR Cameras and Digital Technologies. Nearly 75% of respondents indicated that they use portable IR cameras in their facility; this data point maps well onto the 72% of respondents who engage in IR thermography as part of a predictive maintenance program. Interestingly, there did not seem to be a connection between respondents’ willingness to use portable IR cameras and their use of IR windows: about two thirds of those who said they had no plans to deploy IR windows still use portable IR cameras on the job.

When it comes to wearable safety systems and sensors, just 1 in 3 respondents said they currently use wearables, with 51% reporting that currently there are no plans to implement this technology.
Finally, two questions asked about the degree to which internet-enabled technologies are in use, with 44% reporting that they are using the IoT to monitor their electrical systems and 39% using the IoT to report on system health.
Outsourcing. Not every plant has the full-time resources to conduct electrical work – a fact that may affect uptake of safety technologies. For this question, 77% of respondents said that they outsource installation work; 63% and 61% said they outsource testing and repair work, respectively; and 43% said that they outsource the condition monitoring of their electrical systems (50% keep it in-house).
About the Author

Thomas Wilk
editor in chief
Thomas Wilk joined Plant Services as editor in chief in 2014. Previously, Wilk was content strategist / mobile media manager at Panduit. Prior to Panduit, Tom was lead editor for Battelle Memorial Institute's Environmental Restoration team, and taught business and technical writing at Ohio State University for eight years. Tom holds a BA from the University of Illinois and an MA from Ohio State University