Making FMEA the heart of an equipment maintenance plan
The primary purpose of an equipment maintenance plan (EMP) in a manufacturing facility is to minimize the impact of unplanned events on safety, the environment, and business profitability. The reliability tool best serving as a vehicle to achieve and sustain EMP goals is the failure modes and effects analysis (FMEA). Optimum long-term cost of ownership is typically a result of an effectively facilitated and thoroughly implemented FMEA.
Laying the Groundwork
The first step in laying the groundwork for an FMEA-based reliability improvement effort is to identify candidate equipment. The preferred method is by criticality analysis, a tool used to evaluate how equipment failures impact organizational performance in order to systematically rank plant assets for the purpose of work prioritization, material classification, preventative maintenance / predictive maintenance (PM/PdM) development, and reliability improvement initiatives.
The criticality analysis is a team effort which requires cross-functional input from Operations, Maintenance, Engineering, and Materials Management groups; and representation from the Environmental Health and Safety (EH&S) organization. This team will identify a prioritized list for EMP development.

Next, ensure that design criteria, existing maintenance tasks, operating strategies and past experiences are available for inputs to the subsequent FMEA. These are typically found in:
• Equipment Files & Drawings
• Failure Reporting and Corrective Action System (FRACAS)
• Safety Event Tracking
• Asset Utilization Database
• Computerized Maintenance Management System (CMMS)
• Reliability Near-Miss Tracking
• Process Database
After the candidate equipment is identified and front-end information is gathered, develop an FMEA project charter that clearly defines the following:
• Problem & Goal Statements
• Value Proposition
• Scope & Boundaries
• Team Members (Roles & Responsibilities)
• Deliverables
• Project Timeline
Conduct the FMEA
FMEAs are not developed in a vacuum – they are typically conducted by a diverse team with different views and expertise of the equipment and processes under investigation. Be sure to include front-line operators and maintenance specialists on the team, and include the process owner as an ad-hoc member.
The first step in conducting the FMEA is to build a functional block diagram (FBD), which shows how different components interact with each other and which describes each component and its function. The FBD shows major components as blocks connected together by lines that indicate the relationships of components and which establish a structure around which the FMEA can be developed. The FBD should always be included with the FMEA.
Next, calculate the baseline Overall Equipment Effectiveness (OEE) and the associated financial impact for the equipment targeted for improvement. Three years of historic data are ideal but as little as one year can suffice. The FMEA project charter is updated with the baseline OEE and target OEE including the value proposition.
There are three OEE factors to consider in its calculation:
OEE = Availability x Performance x Quality
Where,
Availability = Operating Time ÷ Planned Production Time
Performance = (Total Pieces ÷ Operating Time) ÷ Ideal Run Rate
Quality = Good Pieces ÷ Total Pieces
FMEA Phase 1 Analysis – Definition and Identification
Once the team has identified the focus equipment’s functions and measured baseline reliability, the team can proceed to Phase 1 of the FMEA analysis. The elements of Phase 1 analysis are defined in terms of equipment function and functional failure, as detailed in the FBD, along with each component failure modes, root causes, effects of failure and current-state controls.
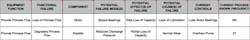
There are many types of FMEA and different versions, but we’ll use the pump system FMEA shown in Table 1:
• Equipment Function - List the functions of the equipment being studied
• Functional Failure - List the situation in which the functions would be considered lost. Most functions will have more than one loss condition
• Component - A grouping of parts into some identifiable package that will perform at least one significant function, typically an item identified in the FBD
• Potential Failure Mode(s) - The manner by which a possible failure is observed; it generally describes the way the failure occurs or its observable characteristics
• Potential Effect(s) of Failure - Describe what will happen if the failure mode occurs
• Potential Cause(s) of Failure - Try to anticipate the cause of the failure mode described
• Current Controls - What are we doing now (the current state) that prevents, mitigates, or detects the previous cause
• Current Process Frequency – How frequent are the current process controls done?
The next step in Phase 1 analysis is to identify potential failure modes and their effects, root causes, and detection processes. Brainstorm all possible failure modes, including those that have occurred and rare problems. Then, for each failure mode listed, associate all possible causes. Ask “why” until the root cause is revealed. Review all potential causes of failure, and identify actions already taking place to eliminate the causes of failure. Also, identify how the causes of failure are currently detected and intervention tasks and their frequencies to reduce the severity of the effects on the production process.
This step typically involves some form of condition monitoring or alarms systems to alert the operator in the early stages of failure. Potential failure modes, root causes, failure effects and detectability can be further explored using a variety of supplementary reliability tools:
• Brainstorming – Explores potential failure modes, causes and their effects
• 5-Why Analysis – Drills down to root causes
• Fishbone Diagram – Analyzes cause and effect relationships
• Data Mining – Quantitatively measures the effects of failure
FMEA Phase 2 Analysis – Quantifying, Prioritizing and Mitigating Risk
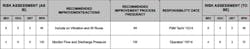
To begin Phase 2 analysis, the team quantifies the risk of each failure mode under the current control process. Risk is measured using a risk priority number (RPN) that is the product of severity, likelihood of occurrence, and detectability factors. Assigning RPNs to failure modes helps the team prioritize areas to focus on and can also help in assessing opportunities for improvement.
[sidebar id="2"]
For every failure mode identified (see Table 2), the team should answer the following questions and assign the appropriate score:
RPN = SEV x OCC x DET
Where,
Severity (SEV) - If this failure mode occurs, what impact would the failure have on EH&S, Capacity, or Cost? Assign a score between 1 and 10, with 1 meaning “no impact” and 10 meaning “extreme impact”.
Likelihood of Occurrence (OCC) - How likely is it that this failure mode will occur? Assign a score between 1 and 10, with 1 meaning “very unlikely to occur” and 10 meaning “very likely to occur”.
Likelihood of Detection (DET) - If this failure mode occurs, how likely is it that the failure will be detected? Assign a score between 1 and 10, with 1 meaning “very likely to be detected” and 10 meaning “very unlikely to be detected”.
There is no value above which it is mandatory to take action or below which the failure mode is exempt from action. However, start with the top 20% RPNs and prioritize using the following guidelines:
• Severity (SEV) is given the most weight when assessing risk.
• Severity and Occurrence (SEV x OCC) combination would then be considered.
The next step in Phase 2 analysis is to minimize risk by utilizing the team’s expertise to brainstorm ways of reducing the severity, likelihood of occurrence, or detectability of the failure. Include the process owner in developing the improvements, as this will prove invaluable when negotiating roadblocks in their implementation.
Define risk mitigation tasks and their respective frequencies for the top 20% RPNs, and prioritize the implementation of those tasks that provide maximum value by either detecting failure at the start of its potential failure (PF) curve (see Figure 1) or by preventing a failure from occurring in the first place through re-design efforts.
Potential mitigation tasks, frequencies, their potential value, and ownership can be further explored using a variety of supplementary reliability tools:
• Brainstorming – Explores potential risk reduction tasks
• Cost/Benefit Analysis – Assists the team to select optimum solutions
• Potential Failure Curves – Maps failure development
• RACI Chart – Aligns roles and responsibilities
Selected tasks are assigned ownership to the appropriate functions including detailed responsibilities and timing. New RPNs are calculated using the projected severity, likelihood of occurrence, or detectability factors and added to the FMEA.
Implementing Solutions
When poorly implemented, even the best solutions are doomed to fail, so don’t treat this phase of the project lightly. Below are several key actions necessary to effectively implement solutions:
• Gain support of the process owner
• Obtain agreement from the person being assigned the action items
• Clearly define tasks including ownership and delivery dates
• Follow the Management of Change (MOC) process
• Input action items into your company’s tracking system
• Monitor the effectiveness of action item implementation
• Update FMEA
One year after full implementation, recalculate OEE and estimate value delivered by the EMP, and then promptly communicate success to key stakeholders.
The EMP and FMEA are living documents and require periodic reviews. Whenever a failure occurs the FMEA should be updated with new failure modes or root causes. If the failure mode was previously identified, the mitigation strategy should be re-evaluated. The documents should also be proactively reviewed annually as part of your company’s Document Control process. Use this powerful strategy – do not let it collect dust!
Further information
Criticality Analysis: Single Point Lesson: Criticality Analysis; Life Cycle Engineering; http://www.lce.com/pdfs/SPL_RXM_Criticality_Analysis.pdf
Project Charter: Meaning, Importance and its Elements; Management Study Guide; http://managementstudyguide.com/assembling-project-charter.htm
Failure Mode Effect Analysis: FMEA from Theory to Execution, 2nd Edition; D.H.Stamatis
[sidebar id="2"]