With the invasion of nonlinear loads, such as computers, variable speed drives and other switch mode power supplies, our ability to deal with unexpected equipment behavior is confused by a mass of technical jargon offered both as explanation and solution. Revisiting the past when amps were amps and volts were volts might help in applying previous experience to understanding the sometimes-mysterious issues of harmonics and power quality.
The early years
Life was simple when distorted voltage and current meant only too much or too little. Voltage and current were measured with simple meters. There was no need to worry about true root mean square (RMS) values, instantaneous peaks or distortion percentages. You knew 480 volts was just 480 volts and equipment with a 480-volt nameplate would work fine...most of the time. If the measured voltage was too high or too low, you could expect some extra heating or fuse blowing. If the measured current to a 100-hp motor was 124 amps in each of three phases, the motor was near full-load. If phase currents differed, the voltage supply was not balanced or there was something wrong with the motor. If measurement revealed more than full-load current, the motor was overloaded or the voltage was too low and the motor might run hot.
The resolution of voltage and current problems was selected from a small list of well-known solutions. However, fixing the problem could wait and production continued, maybe with a larger fuse, until a more convenient time to make the necessary changes presented itself. We knew that unbalanced voltages applied to a three-phase motor would result in unbalanced currents. Also, the motor might run a little hotter if the problem was not fixed immediately. This was acceptable for a short time so that production was not affected.
Technology shifts
Most of the traditional ways of dealing with voltage and current problems are being abandoned because of the confusing terminology and explanations being offered as solutions to the "new" problems associated with nonlinear loads.
By offering regulated voltage sources and transmission and distribution systems capable of handling huge currents, the local electric utility supplies most of the power needs. The main concern for the user is to maximize the amount of work being performed with the least amount of current transferred from the utility to the user's process.
Minimizing reactive current has always been a concern since utilities often impose economic penalties when your reactive current is too large. With a large reactive current, the low power factor the utility sees places too much of a demand on transmission and distribution systems. This reduces the allowable energy--real work--transferred from the utility to the customer and reduces utility revenues.
The impact of nonlinear loads
Life has become more complex with the introduction of electrical equipment using the latest technologies for power conversion, control and communications. Most equipment using these technologies changes AC line power to DC power. This equipment uses power in a nonlinear fashion. Power is still the product of voltage and current, but with nonlinear loads, current may be zero while a voltage is applied to the load. This unique relationship between voltage and current defines a nonlinear load.
Since there is a direct relationship between the current waveform and power--real work--being transferred, the area under the current curve or waveform represents the power transferred. Most office equipment, for example, converts or rectifies AC power to DC power and creates little reactive current. The current, although in phase, does not follow the sinusoidal shape of the voltage waveform and therefore is called nonlinear.
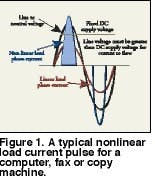
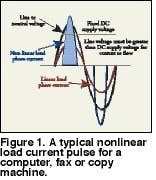
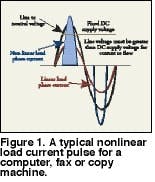
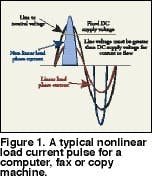
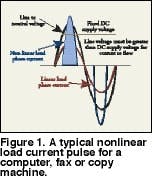
For office equipment, the area under the curve of the current waveform defines the consumed power. Figure 1 shows a typical nonlinear load current pulse for a computer, fax or copy machine. The area under this curve must be equal to the area under the curve for an equivalent linear load since both consume the same power. The rectification process reduces the width of the pulse to less than the 8.3 milliseconds, or half cycle, of a linear load. Since the width is reduced, the height of the pulse must increase. The value of the RMS current for the nonlinear load increases slightly. The peak of the current pulse may be two to five times greater than the normal value of 1.414 times the RMS value of a pure sinusoidal waveform.
Although the RMS value of the current is approximately the same, the peak value creates problems if fuses and circuit breakers are not rated for the larger peak value. These current pulses cause non-sinusoidal voltage drops throughout the distribution system. The resulting voltage drops add or subtract from the sinusoidal voltage supplied by the utility. This results in a distorted voltage that supplies other utility customers and other equipment on the downstream side of the distribution system. Solving complex problems in electrical systems and components begins with trying to understand their behavior when subjected to current pulses and the attendant voltage distortion.
The current pulses are not simple sine waves that can be measured with simple meters. When problems occur, electrical equipment cannot simply be restarted and run until a more convenient time to investigate and fix the problem.
Although the same types of electrical events occur, like random fuse-blowing, overvoltage and undervoltage trip, our well-known list of solutions for fixing electrical problems seems not always to apply. Our search for answers from equipment suppliers results in more confusion and more technical jargon. Although the technical jargon may be interesting, we need to concentrate on the fundamentals. Do we need to understand every aspect of harmonics or can we boil the technical jargon down to the basics and apply some simple rules in dealing with the problems that are likely to occur?
A practical review of harmonics
Pure waveforms exhibit a single frequency. Figure 2 shows three waveforms, each with a single, but different, frequency. These waveforms might be voltage or current. The top waveform is a 60-Hz waveform. The next waveform has a frequency twice that of the top waveform (120 Hz). The lower waveform has a frequency three times the first (180 Hz). The frequency identifies how many times per second the instantaneous value repeats.
The RMS value identifies the values of these waveforms. A 60-Hz current waveform with an RMS value of 10 amps causes 10 volts to be dropped across a one-ohm resistor. A 120-Hz current waveform with an RMS value of 10 amps also causes 10 volts to be dropped across a one-ohm resistor. In fact, any current waveform of the same RMS value produces the same voltage drop across a one-ohm resistor. The power loss across the resistor is the voltage drop (10 volts) times the current value (10 amps), or 100 watts.
To determine the losses in any electrical circuit, calculate the losses in the components in a circuit. Since every electrical circuit exhibits resistive, capacitive and inductive components, determine the losses produced when current flows through each component. Only the resistance component ignores the frequency of the current waveform. The capacitance and inductance values change as the frequency of the waveform changes. As long as the current waveform has only a single frequency, we can easily calculate the losses. How do we calculate losses in an electrical circuit when the waveform contains more than one frequency? The current waveform shown in Figure 3 contains more than one frequency--harmonics. To determine the losses in a circuit, break the waveform apart to identify individual frequencies.
Figure 4 shows two current waveforms of different frequencies. One waveform is the 60-Hz fundamental; the other is a waveform with a frequency five times greater than the fundamental. That frequency is 300 Hz and is referred to as the fifth harmonic since it is five times the 60-Hz fundamental. Adding the individual waveforms together produces the waveform shown in Figure 3. The work and losses caused by the 60-Hz waveform can be determined by traditional methods. The 300-Hz waveform has a lower RMS value than the fundamental. The RMS value of the 300-Hz waveform also produces watts, some of which produce mechanical work and some produce only losses in the form of heat. The work and losses caused by the 300-Hz waveform can also be determined by usual methods taking the frequency into account. The total work and losses are determined by squaring the results for each waveform, adding those results and then taking the square root of the sum. For example, the power transferred by the 60-Hz portion of the waveform is 100 watts of work and 10 watts of losses. The power transferred by a 300-Hz portion of the waveform is 20 watts of work and two watts of losses. The total power transferred is the sum of the real work and the reactive work or losses. The total real work would be equal to the square root of the sum of 1002 + 202, or 102 watts. The total losses would be equal to the square root of 102 + 22, or 10.2 watts. One can see that the harmonics, which are usually much smaller than the fundamental, have little impact on the work or losses in an electrical circuit.
Essentially, the term "harmonics" refers to a waveform that cannot be described as a single frequency. By analyzing the waveform, it can be taken apart into individual waveforms. The effects of each waveform can then be determined in terms of watts of work and watts of loss. What is important is the RMS value of the voltage or current. Distortion becomes important when peak or instantaneous values become too much or too little. Percent distortion only indicates deviation from a pure sine wave.
Harmonics associated with pulse width modulated (PWM) AC drives, as compared with other types of drives, demand little reactive current. This results in a much smaller demand on the distribution system.
The impact of harmonics on controlling motors
Although the current waveforms that the distribution system supplies to motors controlled by PWM drives contain harmonics, the stress on the system is always less than the stress when the motor is operated directly across the line. Less current is required to run the motor because the PWM drive demands only real current from the distribution system. This is not the case with other types of nonlinear loads, such as welders, electric arc furnaces, DC drives and current-source AC drives. These nonlinear loads produce reactive current that the distribution system must handle. Figure 5 shows the reactive current waveforms for these types of loads. The combination of reactive and distorted current places a greater demand on the distribution system than a fixed-speed motor operated directly across the line would. When compared with other motor drive technologies, only the PWM AC drive reduces the demand on the distribution system because the output section of the drive performs the same function as a power factor correction capacitor in reducing the reactive current component.
Figure 6 describes the typical line current for a PWM drive. The current pulses are in phase with the line-to-line voltages. This shows that PWM drives do not demand the reactive current component that would be demanded when a motor is operated directly across the line. The current in phase A is a composite of two current pulses formed by current flowing from phase A to phase B and from phase C to phase A. Each current pulse is in phase with its supply voltage and therefore is real current producing real work. The area under the curve of each pulse multiplied by the voltage equals the real work--the transferred power.
