If asked to choose between a production focus and a reliability focus, I will select the reliability-centric approach every time. To explain why, first the differences between the two must be clarified.
Production-focused organizations have a “get-it-done” attitude, while cost considerations are of a lower priority. They even throw in some planning and scheduling efforts to improve tool times, but they continue to have failures and lose production. These organizations focus on manufacturing their products and improving their tool times so they can fix more broken equipment.
In contrast, with a reliability-centric organization (RCO), the goal is to avoid breaking the equipment in the first place. (For more on RCOs, read "Reliability-centric organizations"). Once an organization understands the value of driving out poor performing equipment or processes, the organization will improve. However, to make necessary changes and sustain the reliability culture, an ad-hoc approach will not be effective.
An essential component of the RCO is a structured root cause failure analysis (RCFA) process that ties into a structured reliability improvement team (RIT) process. An organization must use a structured RIT process to prioritize and implement the recommendations of the RCFAs. This article takes a deep dive into how the RCFA and RIT processes can work together to drive improved reliability.
RCFA culture
Root cause failure analysis is a tool used to determine the root cause of a failure and solutions to eliminate future failures. Use of the RCFA process is not limited to large failure situations; indeed, the process constitutes a critical element of the overall reliability culture of the organization. To be successful, the RCFA process must contain detailed procedures, and the RITs must follow them.
RCFAs must be performed on equipment and processes that adversely impact an asset’s reliability. This does not mean that an RCFA must be performed on all equipment failures. According to best practice, a set of criteria should be established to identify the Top 10 list of defective pieces of equipment or processes, asset bad actors, and repetitive failures that should be considered for the RCFA process. For example, the Top 10 list can be created based on the maintenance and lost opportunity costs associated with an asset; or assets can be deemed bad actors when they experience three or more failures in a two-year period, and repeat failures can include equipment with multiple failures over the prior six months. The number of failures and time frames can be modified to manage the lists into workable numbers.
Once your Top 10 criteria are established and tracked with data from your computerized maintenance management system (CMMS), the next step is to use the structured RCFA to solve issues and develop solutions and recommendations. When you begin, you may not have enough staff to perform the RCFA on all qualifying failures, so you will need to prioritize those failures. I recommend solving the failures with the largest impact first.
Figure 1 presents an example from company “A” in which the Top 10 items were causing 76% of the maintenance costs versus the bad actors and repeat failures, which prompted us to focus on the defective items on our Top 10 list first.
RIT case study at company “A”
Completed RCFAs include recommendations for improvements, and the structured reliability improvement team process is crucial to implementing those recommendations. This case study examines a site where a structured RIT process was followed.
I was machinery reliability superintendent, and my team developed and used a structured procedure to determine when and how we would perform RCFAs on plant machinery. We began to develop solutions to machinery issues, but our requests for these solutions to be funded and implemented were met with mixed reviews by the managers of the five operational areas involved. In one area, the operations superintendent agreed to every recommended improvement without expressing concern about going over budget. In contrast, another superintendent rejected every recommendation in order to stay within budget. Of the five areas involved, the area overseen by the superintendent who went over budget was the first to improve its MTBR for machinery; moreover, that superintendent was never negatively evaluated for the budget overage.
Adding Structure to the RITs. The plant had a reliability improvement team process, and I asked if I could take over and lead the process. Once in charge, I reviewed the process and evaluated how effectively it was being implemented. I found that the process was sound, based on the corporate procedure, but I also discovered that we were not following the process.
Furthermore, I observed an absence of quality leadership in the five operational teams and at the overall plant level. The first change I made upon assuming leadership of the RIT process was to place the three best leaders (regardless of age or position) in charge of three of the teams, and I took over leadership of the other two teams.
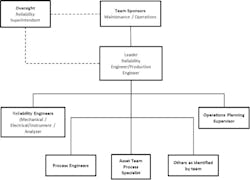
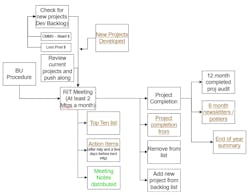
Working together, the three new leaders and I reviewed the procedure and modified it as needed to focus the teams on solving reliability issues within their operating area. The teams met biweekly for no more than one hour to discuss the Top 10 issues. The structure of the teams is provided in Figure 2, and the actual process for the two-week meeting cycle is shown in Figure 3.
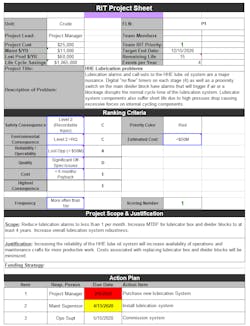
Next, we re-evaluated all the reliability projects using an evaluation form to guide this quantitative assessment (see Figure 3). The process considered costs for asset maintenance and lost opportunities, along with the remaining asset life, to generate a life cycle cost calculation. We evaluated the top 10 to 15 projects on our list in this manner, which enabled us to rank and focus our work on the projects that provided the highest return on investment in terms of both time and money.
Next, criteria that considered safety and environmental consequences, lost opportunity costs, production quality, and the cost of or payback for the project were used to develop an overall ranking. This ranking system allowed us to compare the multiple projects and associated recommendations to arrive at a relative score that could be used to evaluate and rank all projects. (Note: although safety and environmental conditions were evaluated in the ranking criteria, they were not the driving factors for this ranking, because we followed different processes to address safety and environmental issues.)
The project sheet included the project scope, justification, and action plans. The status could be selected from a pull-down menu of eight possibilities each time an update was given on the project. An action plan was also provided to outline the next steps of the project, who was responsible for implementing the steps, and the date by which they were expected to be completed. The due dates were color-coded to indicate if completion of the related goal was past due (red), was coming due within the following two weeks (yellow), or would be due in more than two weeks (no color).
It eventually became clear that the action plans provided the greatest value in the process. The highest-value projects were due to be completed sooner, so team members' buy-in was developed. For example, this system helped to refocus a young engineer who was not completing his assigned tasks. When I asked him why he was not meeting his commitments, he told me he was working on assignments based on the age of the request (per his boss) rather than on its priority ranking from the RIT team. After a quick review with his boss, we agreed to align the prioritization of tasks with the RITs, and the young engineer began to support the reliability team.
We also developed a list of backlog projects using completed project evaluation sheets. We would generally evaluate one or two new ideas during the first 10 minutes of each meeting. This provided the team with a ready file of ranked projects that we could use to replace the projects on our Top 10 list that we completed. During our review of new projects, if we identified a project likely to rank among the top three on our list, we would bump other projects on the list down a notch.
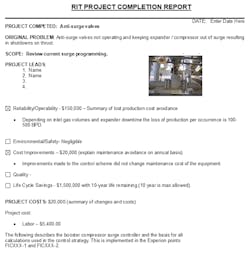
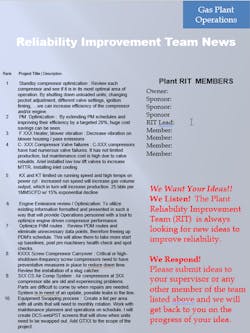
Communication of success. For each project that was completed, we developed a detailed communication of what was done, including the costs and expected benefits, along with the names of the team members (see Figure 4). These communications were distributed plant-wide and served as a great tool for sharing the progress of the team. Audits were performed on all completed projects to ensure that the expected benefits were realized, and feedback was provided to the team. Quarterly and end-of-year messages were also communicated with RIT results achieved, along with costs and benefits of upcoming projects (see Figure 5).
Do not make the process a burden. I did not want participation on reliability teams to be a burden on the team members or the leaders, so meetings were focused and lasted no more than one hour every two weeks. With the project sheets integrated into one spreadsheet per team and some macros developed by team members, the leaders only needed to devote two hours or less between team meetings to managing the process:
Leader – pre-meeting activities:
- Three days before meeting, request updates on assigned action items coming due.
- Update the spreadsheet for meeting.
Leader – post-meeting activities:
- Update RIT team spreadsheet (most updates were made during the meeting).
- Distribute summary list of action items agreed upon at the meeting.
- Distribute updated Top 10 list with status of the projects.
- Create project completion forms and send to me for review and distribution.
Benefits of a structured RIT process
The main benefit of implementing a structured, quantitative RIT process is the creation and implementation of solutions to reliability issues. This process, which integrates operations, maintenance, and capital/turnaround groups, can also solve reliability issues beyond the context of machinery. When this process is implemented, success drives more success and improved reliability.
When we first started the process described in the above case study, we had five teams that functioned independently. Some teams implemented all RIT recommendations, while others addressed very few. As we progressed and demonstrated multiple successes, management directed me to consolidate the overall plant processes and rank all issues together. We began to use a central expense budget and solve the highest-value projects in the whole plant, rather than within the individual teams.
As we proceeded with this centralized process and showed positive results, our budget increased each year. We were given $9.6 million (16%) of the $59 million expense budget to manage RIT issues. If new, high-payout recommendations were developed, we would substitute or replace lower-value recommendations to stay within budget. Our budget was increased each year because we showed management an average process payback of 6-9 months. This payout increased over time due to our process of completing the highest payback projects first. However, we also tracked our Top 10 lists, bad actors, repeats, and availability, and we demonstrated positive results on those metrics as well. This motivated management to increase support and funding for the process.
Structure and leadership are the key to success in solving reliability issues within an organization. Having the right people on the teams is critical to get buy-in and support for the process. Effective leadership of the team along with management support will make this process a valuable part of your organization. If your organization is not making improvements in reliability, review the situation and make changes. Efforts to ensure reliability are contagious, but dedicated leadership is necessary to get those efforts off the ground.


