Sound analysis: Best practices for condition monitoring using ultrasound

Over the past decade or so, it has been interesting to see the evolution of maintenance and reliability. To some, the word maintenance brings a perception of general housekeeping duties such as janitorial tasks or changing light bulbs, but for most, maintenance has become almost synonymous with reliability.
I feel like the reliability field is in a transitional phase as more people are becoming more proactive regarding maintenance rather than being reactive once a failure has happened. Additionally, the condition monitoring tools that are available today are very advanced, and in some cases can give the user almost instantaneous information in order to make a diagnosis on an asset. Mobile devices such as tablets and smartphones have been integrated. For some applications, continuous/remote monitoring is almost a must.
Airborne and structure-borne ultrasound has certainly become a major player in condition monitoring. Once considered just a leak detector, more maintenance and reliability professionals are realizing the benefits associated with using ultrasound for condition monitoring applications, and the I-P-F curve with which we have all become familiar with reflects that trend (Figure 1). We must be concerned not only with the P-F interval, once a failure has been detected, but also with the I-P interval. The I-P interval is where precision maintenance is used to ensure that the equipment is being installed properly using precision balancing and alignment and installing the bearings properly. Precision maintenance is achieved when ultrasound is used to prevent over- and underlubrication of bearings, thus helping to extend the I-P interval.
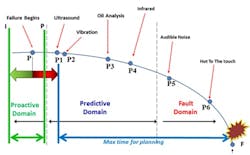
Figure 1. The I-P-F curve shows ultrasound as being the first technology that detects a failure that is mechanical in nature, such as early stage bearing wear, or subsurface bearing fatigue. Precision lubricating bearings with ultrasound helps to extend the I-P interval.
For example, studies have shown that at least 60% of premature bearing failures can be attributed to lubrication problems, whether the result of overlubrication, underlubrication, the presence of contaminants in the lubricant, or the use of the wrong grease for the wrong application. Ultrasound instruments can be used to prevent over- and underlubrication of bearings. The source of the ultrasonic noise is friction. When a bearing is in need of grease, there is an increase in friction, and consequently an increase in noise or decibel level. When listening to a bearing that is in need of lubrication and watching the decibel level on the display of an ultrasonic instrument, as grease is applied, the inspector will notice a gradual drop in the decibel level, moving eventually back down to a more normal level. When grease enters the bearing housing, there is less friction and less noise, which explains the drop in the decibel level. If the bearing is already overlubricated or is already sufficiently lubricated, as soon as grease is applied, the inspector will notice a gradual increase in the decibel level, letting him or her know that the bearing already had enough grease.
There are two common questions that many first-time users of ultrasound technology for condition monitoring have. The first is, “How do I set baselines?” The second is, “How do I know if what I’m hearing is good or bad?” They are valid questions, given that there is no previous ultrasound data on the equipment to be tested, and the users are simply unfamiliar with using ultrasound for this application.
This article will explore three different techniques for condition monitoring with ultrasound tools. For setting baselines, the comparison method and the historical method will be discussed. The third technique is ultrasound imaging, or the use of recorded ultrasounds to make a better diagnosis as to what’s good and what’s bad. When a recorded ultrasound is played back in spectral analysis software, we can view both the FFT and the time wave form of that sound; this approach helps to paint a picture of what it is that we are hearing. Some ultrasound instruments offer the capability to view the FFT and time wave form view in real time while data is collected – a concept sometimes referred to as ultrasound imaging.
The comparison method
One way to get a quick idea as to what is good and what is bad is by using the comparison approach. With this method, the inspector simply compares the decibel level readings at identical points on identical machines (Figure 2).Using this method, the inspector also begins to train his or her ear as to what rotating equipment sounds like, and it will become obvious that a bearing with a particular fault such as an inner race, or outer race defect, will sound much different than a bearing that is in good condition.
The baseline then can be set based off an average of decibel levels at the compared points. The software may even default to the first reading taken and downloaded; however, the baseline can then be changed in the software as more readings are collected.
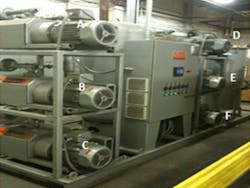
Figure 2. The image above shows where readings were taken at 6 identical motors using the comparison method. The decibel level on the 6 motor outboard points were all within three dB of each other except for Motor B. The Motor B outboard point was 12 dB higher than the other 5 motors, thus indicating a need for further inspection or action.
The historical method
The historical method is the preferred method for establishing baselines and alarm levels in a bearing condition monitoring program. Using this method, the inspector first establishes a route or database in the ultrasound software, which is subsequently loaded into the ultrasonic instrument. Data is then collected at the various points along the route.
When the initial round of baseline data is collected, it may be necessary to collect data more frequently than needed in order to build the history, and get an idea if the decibel readings are remaining similar in the initial historical readings. Once the baseline has been set, as long as the readings are remaining consistent, the frequency at which the readings are collected can be adjusted. For example, when collecting the initial data for setting the baselines, the readings may need to be taken once per week for 4-5 weeks. Once the baseline is set, the readings can be taken only once per month, or every other month depending on asset criticality and equipment runtime. With the initial data history established, the inspector can select the reading that they wish to set as the baseline.
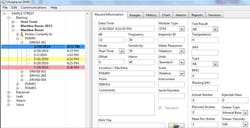
Figure 3a. Screen shot from a typical ultrasound route where data has been collected on three pumps. The Drive A point has been expanded to show 6 historical readings. The reading on March 20 is in bold which represents the baseline. Two alarm levels have been reached: a low alarm on May 20 and a higher alarm warning on July 20.
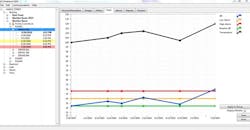
Figure 3b. Historical data plot of 6 readings from the Drive A point. The readings are plotted against a low alarm and high alarm. The plot at the top of the chart is a plot of the temperature readings to show the changes in temperature over the six-month period.
Once a baseline has been established through either the comparison method or the historical method, alarm levels can be set (figures 3a and 3b). A low alarm is set to show a lack of lubrication, and a high alarm is set to show a more critical failure stage for the bearing such as an inner race, outer race, cage, or ball pass fault. Through years of studies and analysis of actual ultrasound data from ultrasound users, it has been determined that an 8dB increase above baseline represents a lack of lubrication, and a16dB increase above baseline represents a more severe failure for the bearing. At the high alarm level, the bearing is in a failure mode that is beyond a lack of lubrication. These alarm levels may need to be adjusted when testing slow speed bearings. Alarm levels for slower-speed bearings (generally below 100rpm) may need to be half of what the normal alarm levels are set, but it really depends on what the decibel level trend of the initial historical readings indicate.
Ultrasound imaging
Through advancements in airborne and structure-borne ultrasound instruments and software, the user can obtain an “image” of the sound that is being heard to analyze, diagnose, and confirm mechanical fault conditions in rotating equipment. The concept of ultrasound imaging is to record ultrasounds heard via the ultrasound instrument, and then play back those recorded sounds in a spectrum analysis software. This will provide the inspector with the audible sound heard in the field during the inspection and a visual “image” or spectrum of the recorded ultrasound in both the FFT and Time Wave Form view. This method will help to reduce the subjectivity of only relying in changes in the decibel level and changes in the sound tone or quality heard by the inspector.
The first example below is from a motor and pump combination where there were a total of eight of these all running the same and performing the same function. The 60hp motor was powering a pump that was pumping water. The image below was taken while the data was collected. The comparison below is between two of the eight total motor and pumps.
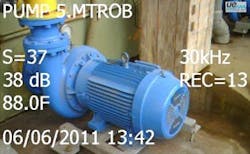
While collecting data, both decibel readings and sound files were recorded. The below screen shots from the spectral analysis software that was used show a comparison between the points “PUMP 3 MTROB 007” and the “PUMP 4 MTROB 010.” The images are FFT images from the spectrum analysis software that were captured after the recorded ultrasound had been played back. A spectrum analysis software is usually available for instruments that have onboard sound recording. The instruments used to collect this data also had onboard spectrum analysis which shows the FFT and time wave form views on the display in real time while the data is collected.
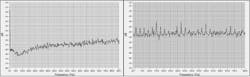
Figure 4. FFT images of two motor-and-pump units (Pump 3 MTR OB, good, at left; Pump 4 MTR OB, bad, at right) from spectrum analysis software that were captured after the recorded ultrasound had been played back.
Hear it:
Pump 3 - www.plantservices.com/assets/Media/1506/pump-3.wav
Pump 4 - www.plantservices.com/assets/Media/1506/pump-4.wav
Notice the difference between the two data points in Figure 4. Both motors are operating under the same conditions, but the Pump 4 MTR OB point has a much different spectrum. If you were listening through the headset of the ultrasound instrument, it would also have a much different sound. Another image of the Pump 4 MTROB point, captured from onboard the ultrasound instrument, can be seen in Figure 5.
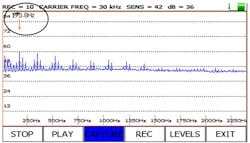
Figure 5. Pump 4 MTR OB from ultrasound instrument. Notice the distinct 175.8Hz harmonics detected.
The spectrum analysis software used has a built-in bearing fault frequency calculator. By entering in the speed (rpm) and the number of balls (bearings), an outer race, inner race, ball pass, and cage frequency are calculated. For this particular motor, the speed was 1750rpm and the type and number of bearings was confirmed to be 10.The fault frequency calculated by the spectrum analysis software confirmed an inner race fault at 175Hz, which is the same fault harmonic detected on the ultrasound instrument. Another interesting point was the fact that the vibration analysis data was collected two days later, and did confirm an inner race fault on the Pump 4 motor outboard point.
Ultrasound technology has also proven to be very effective at monitoring slow speed bearings. If you have the right data collector, software, training, and time it can be accomplished with vibration analysis; however, it’s easily done with ultrasound. Even at speeds of 1rpm, ultrasound can be used to listen to slow speed bearings. In extreme slow speed applications, if the bearing is a good condition, there will be little to no ultrasonic noise simply because there is no fault condition that would produce the ultrasonic noise. As a fault begins though, this will be heard via the headset when inspecting the equipment, and it shows up very nicely on the time wave form view when the sound has been recorded (Figure 6).
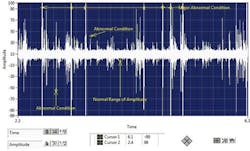
Figure 6. This time wave form view is from a recorded ultrasound of a slow speed bearing on a furnace that is turning approximately 1 rpm. It shows very clearly that the bearing is failing.
Hear it: www.plantservices.com/assets/Media/1506/furnace-bearing.wav
Conclusion
Implementing ultrasound for condition monitoring applications is easier than you think. With a short learning curve, ease of collecting data, and remote monitoring solutions, ultrasound can become another valuable tool to use for your condition monitoring efforts.

Adrian Messer, CMRP, is Manager of U.S. Operations at UE Systems. Contact him at [email protected].
When setting up your ultrasound database, consider starting out with routes that are manageable and will create value to your overall reliability program. Take into account factors such as an asset criticality ranking, inspecting assets with failure modes that ultrasound will detect, or using ultrasound on equipment that has high failure rates to get a better idea as to what might be causing the failures.
When collecting baseline data, consider incorporating "ultrasound imaging," or recording the sound of what you’re hearing. This approach provides additional information for historical purposes such as comparing baseline sounds (FFT or Time Wave Form) to when the same point reaches an alarm level. Once the baseline and alarm levels have been set, the only other time a sound file should be recorded is when the point reaches an alarm level. As long as the decibel readings are below the alarm levels, only the decibel level is stored. Also, when gathering initial data, take before-lubrication and after-lubrication readings. If the decibel level drops after lubrication, then that is the reading that should be used for the baseline since that point was in need of lubrication to begin with.
If these critical steps are followed when establishing ultrasound as a condition monitoring tool, then more problems will be found, premature bearing failures can be greatly reduced, and condition monitoring data collection becomes more effective. Lubrication preventive maintenance tasks also can become more effective because ultrasound trends will show which bearings need to be lubricated. Therefore, instead of greasing everything on a time-based lube route, only the points that are currently in the lubrication alarm from ultrasound trends are greased until the decibel level drops back down to the baseline dB. If you’re only using ultrasound as a leak detector, I would encourage you to take a more in-depth look into condition monitoring with ultrasound.
About the Author

Adrian Messer
CMRP, Vice President of Executive Services, Progressive Reliability
Adrian Messer has worked in the maintenance and reliability field for nearly 20 years. During that time, he has worked with manufacturing and distribution facilities across multiple industries helping to improve their plant’s asset reliability through improved condition monitoring. Adrian is Manager of US Operations at SDT Ultrasound Solutions. Previously he worked with Progressive Reliability to advise companies on reliability-focused contracting & hiring and to find M&R professionals for open jobs.
Adrian is a graduate of Clemson University with a Bachelor of Science in Management with a concentration in Human Resources. He is a Certified Maintenance and Reliability Professional (CMRP) through the Society for Maintenance and Reliability Professionals (SMRP) and is actively involved with SMRP on a local and National level. He resides in Anderson, South Carolina.