Watson: What’s the largest compressed air system you’ve ever worked with Holmes?
Holmes: A 15,000 Hp system spread over 1,100 acres at the G.E. Appliance Park in Louisville.
Watson: That is a big system! How did you get involved with their compressed air system? How did you know where to start with a system that large?
Holmes: We didn’t start with the compressed air system. We started with the total facility. We never try to “guess” what we are going to find. We used our standard procedure of installing an Energy Monitoring System as the first step. Then by keeping an open mind and applying good problem-solving techniques, the resulting data led us to the compressed air system.
Watson: How did you get involved with such a huge complex in the first place?
Holmes: One of G.E.’s facility engineers, Rick, was in Six Sigma training and needed a project. His expertise was with the energy systems and he was interested in reducing the facility’s considerable annual energy costs. Believe it or not, even a facility of that size owned by one of the world’s largest companies had very little energy instrumentation. The 1,100 acre facility only had one electric meter. Other than the one bill, the only energy information Rick had were spreadsheets with monthly totals from 54 electrical sub-meters that were manually read by his staff once a month.
Watson: As I recall, the Six Sigma program is based on analysis of actual measured data.
Holmes: Correct. So Rick’s first step was to hire us to install an Energy Monitoring System. It was originally installed on the utility meter, 5 main electrical transformers and the 54 existing sub-meters.
As Rick began statistically analyzing the resulting data, he was surprised to see how much of the facility’s total, more than 10% of the monthly consumption and demand, was being used by the feeders serving the air compressors.
Watson: I would guess the next step was to install more sensors on the compressed air system to find out how efficiently it was being operated.
Holmes: It was. In order to zero in on the compressed air system with compressors located in a central plant as well as three remote compressor buildings, the Monitoring System was expanded to pick up all eleven compressors, seven existing airflow meters plus the system pressure at various locations on the site.
Watson: Once you had that data, how were you able to sort through all of it and present it to the operators in a format they could easily understand?
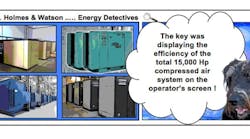
Holmes: The real value of the software came from calculating and displaying the efficiency of each air compressor as well as the total for the entire compressed air system. The key number was the Total cfm/kva or system efficiency as shown on the screen below. The operators took it from there. It was similar to driving your car to keep the mpg readout at its peak. They experimented with the operation of different combinations of compressors during different shifts, production schedules, weather, day of the week, etc. until they determined the most efficient combination for each period.
The operators were not engineers; they didn’t need to be. We didn’t want them to have to pour through strip charts or volumes of data. They knew their plant and equipment so we represented it with the screen displays. It was just as if the operator went to each compressor, meter and gauge and read them manually. It was what they were used to doing. The difference was they didn’t have to drive all over the facility. They could see all of the raw data from one location along with the Energy Analysis that they needed to run the total system most efficiently.
Historical Reports and Graphs provided a record of electrical demand and consumption data, airflow, efficiencies and operating costs every minute of every day. The cost of running each compressor during the month of March is shown below.
Watson: What did G.E. do with the monitored data? Did it help them reduce the cost of operating their air compressors?
Holmes: Within a few weeks after expanding the Monitoring System to the compressed air system, Rick called our office to let us know that he had already found and implemented changes in operating procedures that had increased the efficiency and reduced the operating costs by 20% which, on an annual basis would save between $200,000-$300,000.
He said, “There is no way we could have done this without your Energy Monitoring System. Before we could monitor the entire system from one location, we were making decisions based on individual machines and buildings with no way to determine the overall effect. Unfortunately a lot of those decisions were wrong."
Watson: So the key was allowing operators to see the performance and overall efficiency of the entire compressed air system in an intuitive, easy-to-understand format.
Holmes: Watson, you're a genius. As a result, the cost of the monitoring system was paid back within three months from the savings that Rick and his operators created in their facility.
*This Case Study was presented by Bill Holmes at the 2011 ISA Conference in Mobile, Alabama
Tell us about your experiences, both good and bad with energy professionals, what has worked and what hasn’t. Send us your comments, thoughts and suggestions on how to improve our profession so we can all continue to learn from each other. Thanks – Holmes & Watson.
