Backed by more than 150 years of Danish heritage, Carlsberg is a household name in the United Kingdom and Europe. Carlsberg UK (www.carlsberg.co.uk), which employs around 1,800 people across 16 sites, is a subsidiary of the Carlsberg Group and is the United Kingdom's fourth largest brewer.
Carlsberg UK required a Web-based monitoring and targeting system for multiple plants and distribution depots throughout the United Kingdom. The brewery was looking for a system that could import and calculate weekly KPI data against targets for multiple utilities, including but not limited to gas, water, and electricity, as well as analyze production data and calculate plant efficiency. The brewer also required the ability to manage data imports from a wide range of meters to incorporate complex production procedures in place across the brewing process. This had to be intuitive for access by non-technical users of the system. In addition, Carlsberg UK needed an energy solution to distribute a range of use alarms and average usage alarms automatically via email. The solution needed to provide hourly dashboards at the department-operator level to monitor usage when the plant is running, stopped, during shutdown, and during maintenance periods.
Carlsberg UK chose eSight (www.esightenergy.com) to manage energy usage throughout the brewing process to enable the company to monitor the efficiency of its brewing processes and optimize for best performance, thus saving on bottom-line costs. Activities such as generation of compressed air and excessive water usage required in the brewing industry needed to be monitored and optimized. Compressed-air usage accounts for 8% of total energy consumption, explains Martin Northover, energy & utilities manager at Carlsberg UK.
The eSight solution is used to monitor the plant for shutdown opportunities, and its alarm module generates range and average alarms to be sent via email to alert high usage in specific meters. The alarms are linked to production, allowing for early reaction and quick intervention times to process and reduce losses. This can have a major impact on utilities costs, environmental compliance, and production output.
The eSight system is managed by the Carlsberg UK on-site systems team, and it’s coordinated and facilitated to user departments by the energy center manager and the water and effluent continuous iImprovement manager. Carlsberg UK holds a weekly meeting with user departments to review dashboards, and the weekly KPI data is calculated and compared to targets. This allows for changes to be made to enhance productivity and therefore achieve energy savings.
"ESight has enabled us to visualize and measure our utility usage against production in a way that wasn’t previously possible,” explains Paul Harris, site energy manager at Carlsberg UK.
Since implementing eSight, Carlsberg UK has achieved a number of energy saving goals, including:
- reduced overall energy consumption by 10%
- improved recovered energy from brewing process, which accounts for 60% of site usage
- reduced site water consumption by 10%
- reduced effluent cost by 16%.
Reduction of overall energy usage was achieved by understanding consumption loads and matching with production periods. Carlsberg UK is able to utilize its CHP plant and recover heat by matching to process demands, which has improved recovered energy from the brewing process.
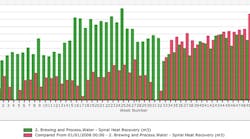
The eSight suite is used as primary measure at the production level, focusing on software and plant improvements. The dashboard module enables the user to bring together essential energy information, charts, or tables on a single page. Users may run up to four interchangeable screens side by side, with each screen automatically updating every minute. Carlsberg UK uses the dashboard module to highlight areas of performance that are most important to them.
