In brief:
- Perhaps true perfection does not exist in compressed air systems, but the journey toward perfection can result in significant energy savings.
- Almost all of the energy input to an air compressor is converted to heat.
- There are a number of ways to produce compressed air more efficiently; most of these apply to equipment located in or near the compressed-air room.
The word “perfect” is not commonly used when describing the performance of a typical compressed air system. A good quality, fully loaded, air-cooled, lubricated rotary-screw compressor consumes about 16.5 kW of power to produce 100 cfm of compressed air at 100 psi. Refrigerated air drying of this air costs another 0.5 kW/100 cfm.
Where does the energy go?
|
Read more articles by Ron Marshall Are VSD-controlled compressors best for regulating air pressure? Study shows lack of compressed-air-system training |
This low-power conversion efficiency may surprise you, and you may wonder where all the remaining energy goes. If you visit your compressor room it will become obvious; the most significant output of an air compressor is heat. Almost all of the energy input to an air compressor is converted to heat. An air compressor produces about 2,545 Btu/hr for every brake horsepower (bhp) of compressor capacity. If you do the conversion, you’ll find of 2,545 Btus is equivalent to about 0.746 kW of electric heat (or about 1 hp). Because modern air compressors are typically loaded into the motor service factors the equivalent energy input to the air compressor is slightly more that the heat of compression that comes out. The difference is the energy imparted to the compressed air.
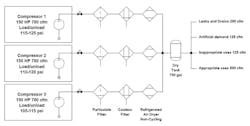
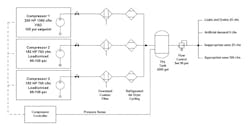
But let’s explore a real-world, typical “imperfect” system. Let’s choose a typical compressed-air system using three 150-hp, air-cooled lubricated screw compressors, using three separate non-cycling refrigerated air dryers, each with one particulate and coalescing filter installed (Figure 1). The system has 2 gal of storage per cfm or 1,400 gal, as recommended by the manufacturer, and the compressors will operate in load/unload mode with controls set up in a cascaded arrangement with 10 psi wide pressure band for each compressor with 5 psi between steps. The system loading is such that the system will operate with two normally running main compressors and one hot backup. Condensate drains for the compressor and dryer are timer-controlled. We can calculate what the conversion efficiency of this real-world system would be if applied to a typical shift-oriented industrial plant, operating continuously.
Figure 1. We can calculate what the conversion efficiency of this real-world system would be if applied to a typical shift-oriented industrial plant, operating continuously. (Source: Compressed Air Challenge)
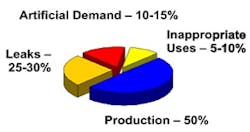
Figure 2: About one-eighth of the compressed air is extra flow consumed by end uses because the system pressure is higher than the user needs; this flow is called artificial demand. (Source: Compressed Air Challenge)
The Compressed Air Challenge (www.compressedairchallenge.org) has discovered by sampling numerous industrial facilities that typically only 50% of all the compressed air produced by industrial air compressors is actually consumed by appropriate end uses (Figure 2). About one-quarter to one-third of the compressed air is wasted due to leaks before it gets to the end use. About one-eighth of the compressed air is extra flow consumed by end uses because the system pressure is higher than the user needs; this flow is called artificial demand. The remaining part is compressed air that shouldn’t be consumed at all because the uses are inappropriate — uses such as condensate drains that blast compressed air to clear separator bowls, blowing compressed air on a motor to cool it, or air-consuming equipment left on even when the machine is not producing any product. Our real-world-example system has these same characteristics.
The real-world system has a typical 24/7 load profile, where compressed-air production is high for 16 normal hours and is lower for midnight shifts during weekdays, with minimal compressed-air load during weekend loads, mostly consisting of plant leaks. Studies by compressor manufacturers have shown that about 65% of all industrial systems operate with this type of profile.
This example production schedule might have the following characteristics.
| Shift | Annual Hours | New Average cfm | Average psi | Required |
| Weekday normal production | 4,100 | 1,000 | 115 | 2 compressors |
| Weekday midnight | 2,000 | 625 | 120 | 1 compressor |
| Weekend/holiday | 2,660 | 370 | 120 | 1 compressor |
| Total | 8,760 |
The calculated power consumption would be as follows
| Shift | Annual Hours | Average cfm | Average psi | Compressor kW | Dryer kW | kWh |
| Weekday normal production | 4,100 | 1,000 | 115 | 202.3 | 16.2 | 895,850 |
| Weekday midnight | 2,000 | 530 | 120 | 113.0 | 16.2 | 258,400 |
| Weekend/holiday | 2,660 | 370 | 120 | 95.8 | 16.2 | 297,920 |
| Total | 8,760 | |||||
| Weighted Ave | 701 | 165.8 | 16.2 | |||
| Specific Power | 23.6 |
The operating power for this system is calculated using the Compressed Air Challenge’s power vs. flow curves, along with the Compressed Air and Gas Institute (CAGI) data sheet for the proposed compressor type. In this case, compressor data for a unit with 700 cfm output consuming 126 kW at 125 psi (18 kW/100 cfm) has been used. Data for the air dryers is for 700 cfm units consuming 5.4 kW each. Since all units are hot spares, the total consumption is 5.4 x 3 = 16.2 kW. The total compressed-air-system energy consumption is calculated by totaling the energy consumed for each shift type.
In the case of the main production shift, one compressor is fully loaded at 700 cfm output and the other compressor is partially loaded at 300 cfm. Since the compressors operate at 115 psi, about 10 psi below their rated pressure, the power used in the calculation is reduced by about 5% to account for lower power at lower-than-rated pressure (compressors consume about 1% less power for every 2 psi pressure reduction around 100 psi).
The power consumption for the compressors for the main shift is as follows:
Fully loaded compressor (700 cfm): 126 kW x .95 = 119.7 kW (adjusted for pressure)
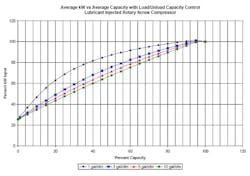
Partially loaded compressor (300 cfm or 43% loaded): From Figure 3, this compressor would consume 69% of its pressure adjusted full-load power or 119.7 x .69 = 82.6 kW. Total power would be 202.3 kW.
Power for the other shifts are calculated as follows:
For midnight shift = 126 x .975 x .92 = 113.0 kW
For weekend/holiday = 126 x .975 x .78 = 95.8 kW
At $0.10/kWh, this compressed-air system would cost $145,220 in electrical costs to supply about 701 cfm of average air demand. Specific power consumption of the total air flow is about 23.6 kW/100 cfm. If you consider that 50% of all the air produced is wasted, the real-world specific power for the compressed air supplying all the appropriate uses is 47 kW/100. This makes the energy conversion efficiency of the power supplied to operate the example paint-mixer air motor about 3.5%.
Figure 3: Flow vs. power for lubricated screw compressors at various receiver sizes. (Source: Compressed Air Challenge)
Can we approach perfection?
Is it possible to approach perfection in a compressed-air system. The answer is yes, by applying common efficiency measures to both the production and conditioning of the compressed air and the use of this expensive resource wisely. Basically there are only two ways to reduce the operating costs of a compressed air system:
- produce the air more efficiently
- produce less compressed air.
One could argue that a third way to reduce operating costs would be to use the heat of compression to displace energy required in some other process or to supplement building heat (for a detailed look at recovering heat of compression, see Hank Van Ormer’s article, Drive down your energy costs with heat of compression recovery). This is beyond the scope of this article but definitely worth consideration.
Producing more efficiently
|
Compressed Air Challenge The CAC is a voluntary collaboration of:
The mission of the CAC is to be the leading source of product-neutral compressed air system information and education, enabling end users to take a systems approach, leading to improved efficiency and production, and, ultimately, increased net profits. Compressed Air Challenge provides numerous helpful information resources about compressed air efficiency in materials on its website. |
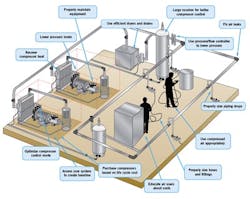
There are a number of ways to produce compressed air more efficiently; most of these apply to equipment located in or near the compressed-air room. These measures apply to both the air compressors and the compressed-air treatment systems — air dryers, filters, drains. Some of the most common measures are:
- purchasing compressors with low specific power (consulting CAGI specifications), including at a properly sized VSD controlled compressor
- controlling the compressors to minimize unloaded run time, reduce discharge pressure, and run the most efficient compressors at times where appropriate
- applying large storage receiver capacity to allow compressors to run efficiently and turn off when not required
- reducing compressor discharge pressures by minimizing pressure differentials caused by air dryers, filters, and undersized piping (Piping, fittings, compressed-air conditioning equipment, connectors, and hoses should be selected so that these provide a minimal restriction to flow even in peak conditions to allow the lowest possible compressor discharge pressure.)
- purchasing efficient air-drying equipment that cycle to reduce power on a reduced load and turns off when the associated compressor is off
- turning the compressors off when compressed air is not required
- eliminating wasteful condensate drainage and leakage
- application of pressure/flow controls to reduce plant pressure and eliminate artificial demand while maintaining an adequate supply of stored air for better compressor control.
Using less compressed air
This category represents the biggest payoff in reducing compressed-air costs and is also one of the biggest challenges in trying to achieve perfection. Although not a complete list, some common ways to do this include:
- starting and maintain a leakage repair program and reducing leakage rates to a target level of 5% of average flow
- investigating compressed-air uses to determine if the consumption of compressed air is appropriate (Considering the energy conversion efficiency of a perfect compressed air is a little under 10%, it is prudent to question all significant compressed air uses. Eliminate all inappropriate uses that could be operated using direct drive electric or some other more efficient method.)
- eliminating drainage from downstream filter separator bowls and condensate drainage points
- redesigning problematic compressed-air-powered equipment that force compressor discharge pressures up, causing inefficient artificial demands for all other end uses (Target a maximum plant pressure of 90 psi or lower as an overall plant policy.)
- designing in shutoff valves to automatically turn off the flow of compressed air when production stops (The best kind of shutoff strategy is to completely turn off the flow of compressed air to zones of equipment during non-production hours, reducing leakage.).
Optimized system example
Let’s revisit the system we first discussed and see if we can make some improvements. Using aggressive strategies, we can attack our inappropriate end uses and reduce them to 25 cfm and lower system leakage to 5%. Main and distribution piping can be optimized and end-use supply components can be chosen carefully to allow reduction of the required plant pressure to 90 psi. Compressor discharge pressures can be reduced to 100 psi because of the installation of low differential filters and optimization of the air dryer for very low pressure differential. Air-dryer consumption can be reduced by installing cycling style units sized for each compressor. A new VSD compressor can be selected that’s sized at the next size larger than the fixed speed units (200 hp) to eliminate any control gap issues.
{pb}
The new production schedule for the system would have the following characteristics:
| Shift | Annual Hours | Average cfm | Average psi | Required |
| Weekday normal production | 4,100 | 550 | 95 | 1 compressor |
| Weekday midnight | 2,000 | 345 | 95 | 0 compressors |
| Weekend/holiday | 2,660 | 0 | 95 | 0 compressors |
| Total | 8,760 |
New power and energy consumption on an optimized system would be:
| Shift | Annual Hours | Average cfm | Average psi | Compressor kW | Dryer kW | kWh |
| Weekday normal production | 4,100 | 550 | 95 | 91.9 | 3.5 | 391,140 |
| Weekday midnight | 2,000 | 345 | 95 | 58.7 | 2.4 | 122,200 |
| Weekend/holiday | 2,660 | 0 | 0 | 0 | 0 | 0 |
| Total | 8,760 | |||||
| Weighted Average | 336 | 58.6 | ||||
| Specific Power | 17.4 |
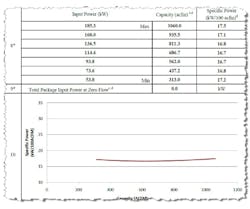
The operating power for this system is calculated using CAGI data from the proposed VSD compressor for 100 psi operation (Figure 4). An example calculation is shown below for weekday flow. Air-dryer consumption is assumed to be proportional to average flow and calculated using dryer CAGI data. Spare air dryers are assumed to be off unless the compressor is called to start.
Figure 4: Excerpt from typical CAGI Sheet for 200-hp VSD compressor at 100 psi. (Source: CAGI)
Example for weekday normal production: 550 cfm x 16.7 /100 = 91.9 kW
New system results
The electrical costs of this new optimized system compared to the base-case system would be lower by about 65%, for a savings of $93,830/yr. Specific power would be about 17.4 kW/100 cfm. If the target waste percentage is reduced to only 10%, rather than the previous 50%, the conversion efficiency to feed the air-mixer motor would be near 8.6%. This assumes the paint mixer really is an appropriate use, of course. If an explosion-proof motor were purchased to drive the paint mixer directly, even with a low motor efficiency, the conversion efficiency for the operation could be a more tolerable 90%. This is definitely something to think about.
Could you achieve the same results?
This type of savings is definitely achievable for typical industrial plants on real-world systems, if compressed air system efficiency is aggressively pursued (Figure 5). The previous calculations were simulated using load/unload compressor operation for the base case. Many systems operate in an even more inefficient modulation mode, with multiple unnecessary compressors operating and causing very poor specific power numbers. Many systems operating in this manner have system-specific power numbers as high as 200 kW/100 cfm and have been found with waste percentage levels of 75% or more of the total compressed air produced. With system numbers like that, it is a sure bet that huge potential savings exist.
Figure 5. The electrical costs of this new optimized system compared to the base-case system would be lower by about 65%. (Source: Compressed Air Challenge)
You may be wondering how your system compares and how close to “perfection” you are. The first question you should ask yourself is: “Why don’t you know?”
| Ron Marshall is a member of the Project Development Committee at the Compressed Air Challenge. Contact him at [email protected] and (204) 360-3658. |
There are affordable instrumentation systems available today that could answer this question very easily on a continuous basis. But as a first step consider having your system assessed by a competent compressed-air-system auditor. Many organizations and service providers exist that can assist you in assessing your system and perhaps getting you in touch with energy organizations that could assist with financial incentives to assess and upgrade your systems.
Perhaps true perfection does not exist in compressed air systems, but the journey toward perfection can result in significant energy savings. Consider taking this journey with your system auditor today.
